Carmen Tur1,2, Francesco Grussu1,3, Ferran Prados1,4,5, Baris Kanber4, Thalis Charalambous1,6, Declan T. Chard1,7, Olga Ciccarelli1,7, and Claudia A.M. Gandini Wheeler-Kingshott1,8,9
1UCL Queen Square Institute of Neurology, University College London, London, United Kingdom, 2Neurology, Luton and Dunstable University Hospital, Luton, United Kingdom, 3Centre for Medical Image Computing, Department of Computer Science, University College London, London, United Kingdom, 4Centre for Medical Image Computing, Medical Physics and Biomedical Engineering department, University College London, London, United Kingdom, 5e-Health center, Universitat Oberta de Catalunya, Barcelona, Spain, 6Department of Medicine, St. George’s University of London, London, United Kingdom, 7University College London Hospitals Biomedical Research Centre, National Institute for Health Research, London, United Kingdom, 8Department of Brain and Behavioural Sciences, University of Pavia, Pavia, Italy, 9Brain MRI 3T Research Centre, IRCCS Mondino Foundation, Pavia, Italy
1UCL Queen Square Institute of Neurology, University College London, London, United Kingdom, 2Neurology, Luton and Dunstable University Hospital, Luton, United Kingdom, 3Centre for Medical Image Computing, Department of Computer Science, University College London, London, United Kingdom, 4Centre for Medical Image Computing, Medical Physics and Biomedical Engineering department, University College London, London, United Kingdom, 5e-Health center, Universitat Oberta de Catalunya, Barcelona, Spain, 6Department of Medicine, St. George’s University of London, London, United Kingdom, 7University College London Hospitals Biomedical Research Centre, National Institute for Health Research, London, United Kingdom, 8Department of Brain and Behavioural Sciences, University of Pavia, Pavia, Italy, 9Brain MRI 3T Research Centre, IRCCS Mondino Foundation, Pavia, Italy
We introduce SSPACE-MS, a new framework for lesion distribution and shape characterisation in multiple sclerosis (MS). SSPACE-MS can be implemented with clinical MRI and here we demonstrate its added value, compared to just lesion load quantification, to predict disability in 62 MS patients.

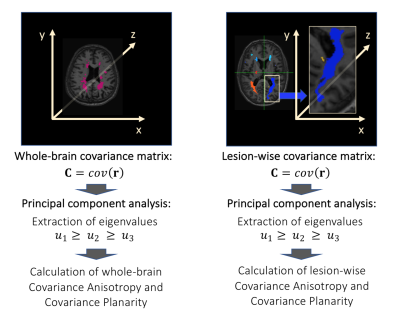
Figure 1. SSPACE-MS pipeline to obtain the geomorphometric measures for the whole-brain lesion mask and each individual lesion. Abbreviations: C: covariance matrix of the 3D positions of lesional voxels; r=(x,y,z) 3D positions of lesional voxels.

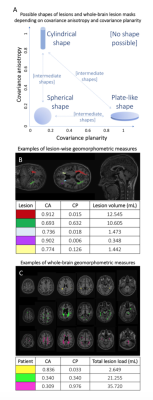
Figure 2. Representation of covariance anisotropy and covariance planarity (A). Some lesion-wise (B) and whole-brain (C) examples. As can be observed, these metrics help characterise the shape of the lesion or that of the whole-brain lesion mask. For instance, we can visually appreciate that the red-delineated lesion in B is very anisotropic and indeed has a very high CA and very low CP. Abbreviations: CA: covariance anisotropy; CP: covariance planarity.
