Chunming Gu1,2,3, Martin Kronenbuerger4,5, Di Cao1,2,3, Adrian G. Paez1,2, Xinyuan Miao1,2, Xirui Hou1,3, Jee Bang5,6, Kia E. Ultz5, Wenzhen Duan6,7, Russell L. Margolis5,6, Peter C. M. van Zijl1,2, Christopher A. Ross5,6,7,8, and Jun Hua1,2
1The Russell H. Morgan Department of Radiology and Radiological Sciences, Johns Hopkins University School of Medicine, Baltimore, MD, United States, 2F.M. Kirby Research Center for Functional Brain Imaging, Kennedy Krieger Institute, Baltimore, MD, United States, 3Department of Biomedical Engineering, Johns Hopkins University, Baltimore, MD, United States, 4Department of Neurology, University of Greifswald, Greifswald, Germany, 5Department of Neurology, Johns Hopkins University School of Medicine, Baltimore, MD, United States, 6Department of Psychiatry and Behavioral Sciences, Johns Hopkins University School of Medicine, Baltimore, MD, United States, 7The Solomon H. Snyder Department of Neuroscience, Johns Hopkins University School of Medicine, Baltimore, MD, United States, 8Department of Pharmacology and Molecular Sciences, Johns Hopkins University School of Medicine, Baltimore, MD, United States
1The Russell H. Morgan Department of Radiology and Radiological Sciences, Johns Hopkins University School of Medicine, Baltimore, MD, United States, 2F.M. Kirby Research Center for Functional Brain Imaging, Kennedy Krieger Institute, Baltimore, MD, United States, 3Department of Biomedical Engineering, Johns Hopkins University, Baltimore, MD, United States, 4Department of Neurology, University of Greifswald, Greifswald, Germany, 5Department of Neurology, Johns Hopkins University School of Medicine, Baltimore, MD, United States, 6Department of Psychiatry and Behavioral Sciences, Johns Hopkins University School of Medicine, Baltimore, MD, United States, 7The Solomon H. Snyder Department of Neuroscience, Johns Hopkins University School of Medicine, Baltimore, MD, United States, 8Department of Pharmacology and Molecular Sciences, Johns Hopkins University School of Medicine, Baltimore, MD, United States
Significant
longitudinal increases in arteriolar cerebral blood volume (CBVa) in
premanifest Huntington’s Disease patients were found in several brain regions
primarily related to motor, visual and cognitive functions using the
inflow-based vascular-space-occupancy (iVASO) MRI at 7T.

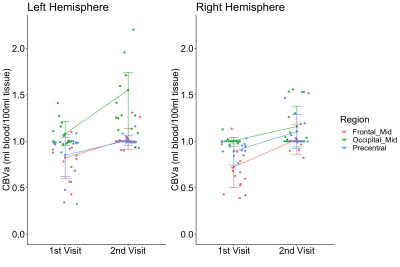
Figure 2: Significant longitudinal increase in CBVa in premanifest HD
patients (n=15). CBVa values in these regions in the follow-up scan were
further increased compared to those at the initial visit (P-value < 0.01, Fisher-Pitman
permutation test, number of permutations = 50000).

Figure 1: Significant clusters of increased CBVa in premanifest HD
patients (n=28) compared to controls (n=18) at the first visit are highlighted
with corresponding relative CBVa changes, calculated by 100%×(HD CBVa - Control CBVa)/(Control CBVa) on the normalized
MNI anatomical template. The colorbar indicates the scale of relative CBVa
change.
