Yuki Kanazawa1, Masafumi Harada1, Mitsuharu Miyoshi2, Takashi Abe1, Yuki Matsumoto1, and Yasushi Takagi3
1Tokushima University, Tokushima, Japan, 2Global MR Applications and Workflow, GE Healthcare Japan, Hino, Japan, 3Department of Neurosurgery, Tokushima University, Tokushima, Japan
1Tokushima University, Tokushima, Japan, 2Global MR Applications and Workflow, GE Healthcare Japan, Hino, Japan, 3Department of Neurosurgery, Tokushima University, Tokushima, Japan
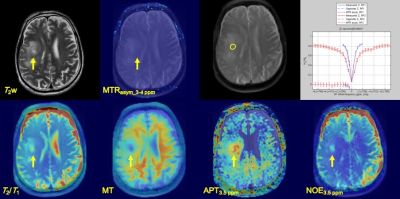
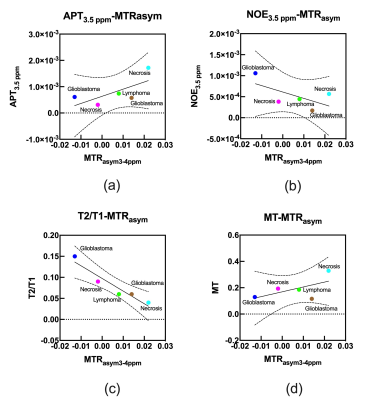
CEST imaging with multi-pool Bloch equation model was demonstrated for brain tumors. Distinguishing APT to NOE signal may lead to more
detailed characteristics of metabolism in brain tumors than that of MTRasym
analysis.

