Sina Mansour L.1, Ye Tian2, Vanessa Cropley2, and Andrew Zalesky1,2
1Department of Biomedical Engineering, The University of Melbourne, Melbourne, Australia, 2Melbourne Neuropsychiatry Centre, Department of Psychiatry, The University of Melbourne, Melbourne, Australia
1Department of Biomedical Engineering, The University of Melbourne, Melbourne, Australia, 2Melbourne Neuropsychiatry Centre, Department of Psychiatry, The University of Melbourne, Melbourne, Australia
Neuroimaging measures that perform well at
behavior prediction are not necessarily best suited to individual
identification, suggesting a dichotomy between prediction and
identification. Nonetheless, high-resolution structural connectome
performed well at both tasks.
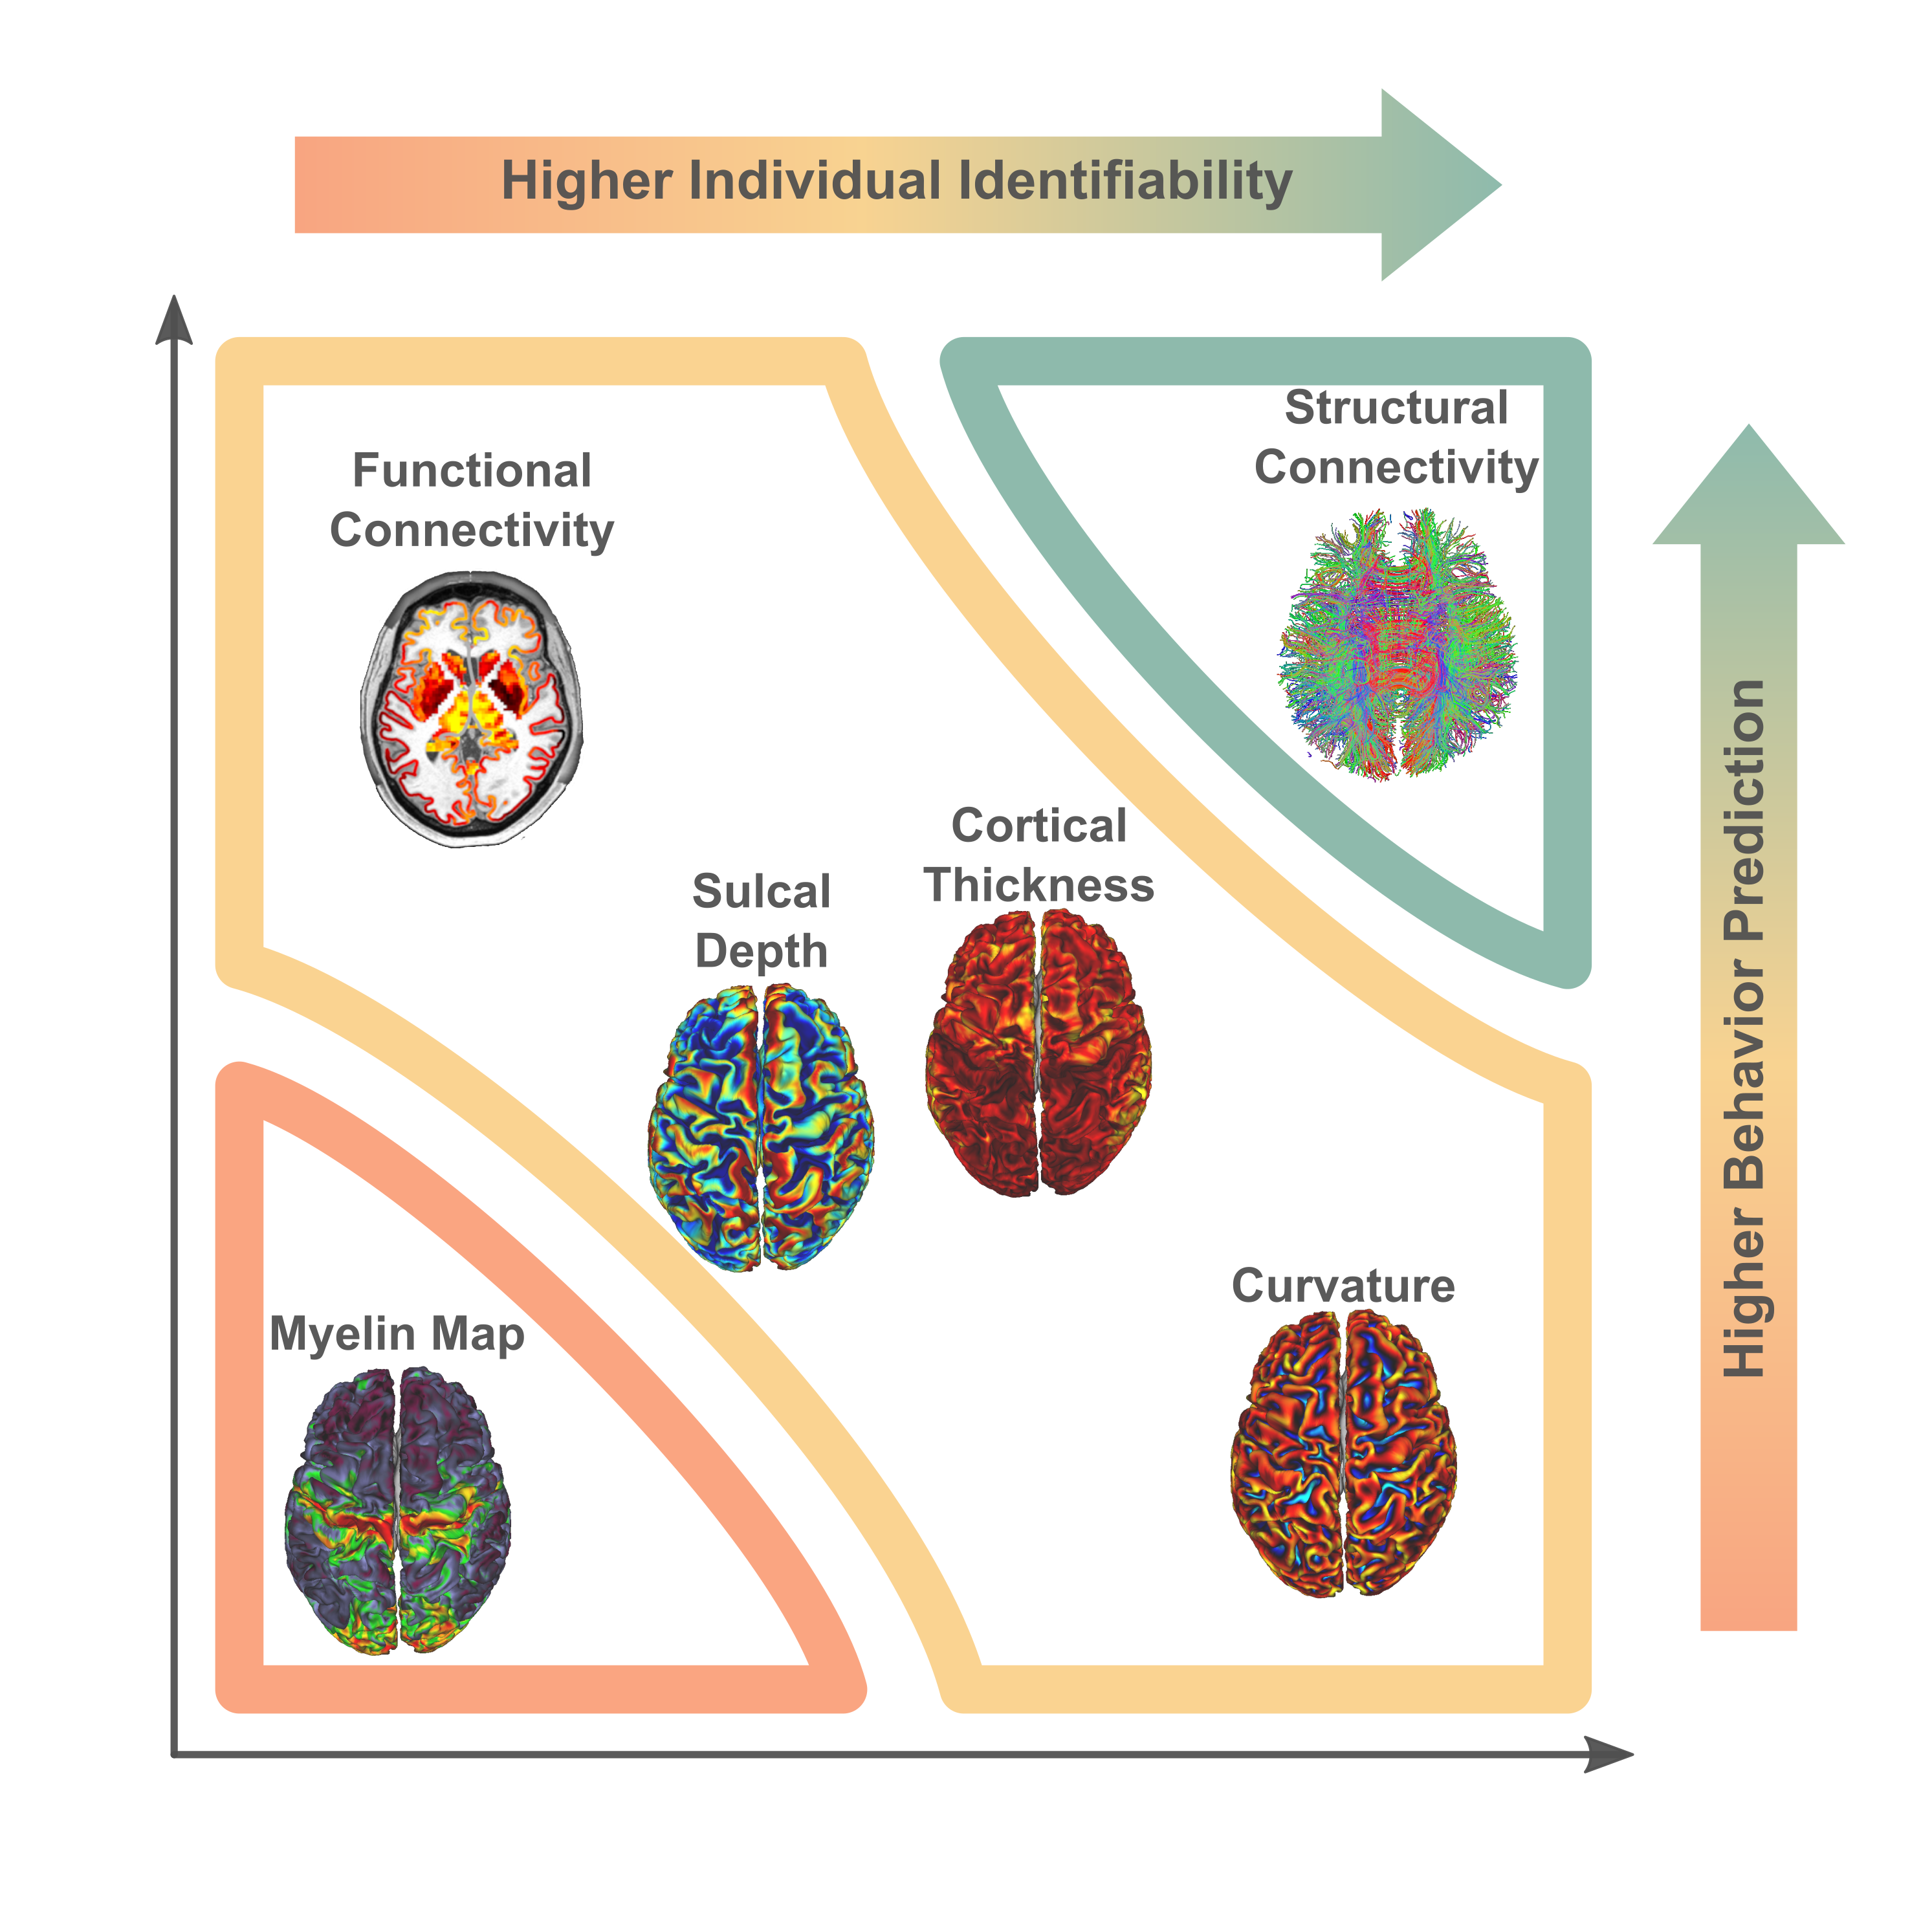
Figure 5:
Neuroimaging-derived phenotypes arranged in a two-dimensional space,
where the horizontal and vertical axes, quantify performance in
behavior prediction (variance explained) and individual
identification (Cohen’s d), respectively. Structural connectivity
performs well for both tasks, whereas a dichotomy is evident for the
other measures. This shows a trade-off where high performance in one
dimension results in low performance in the complementing dimension.
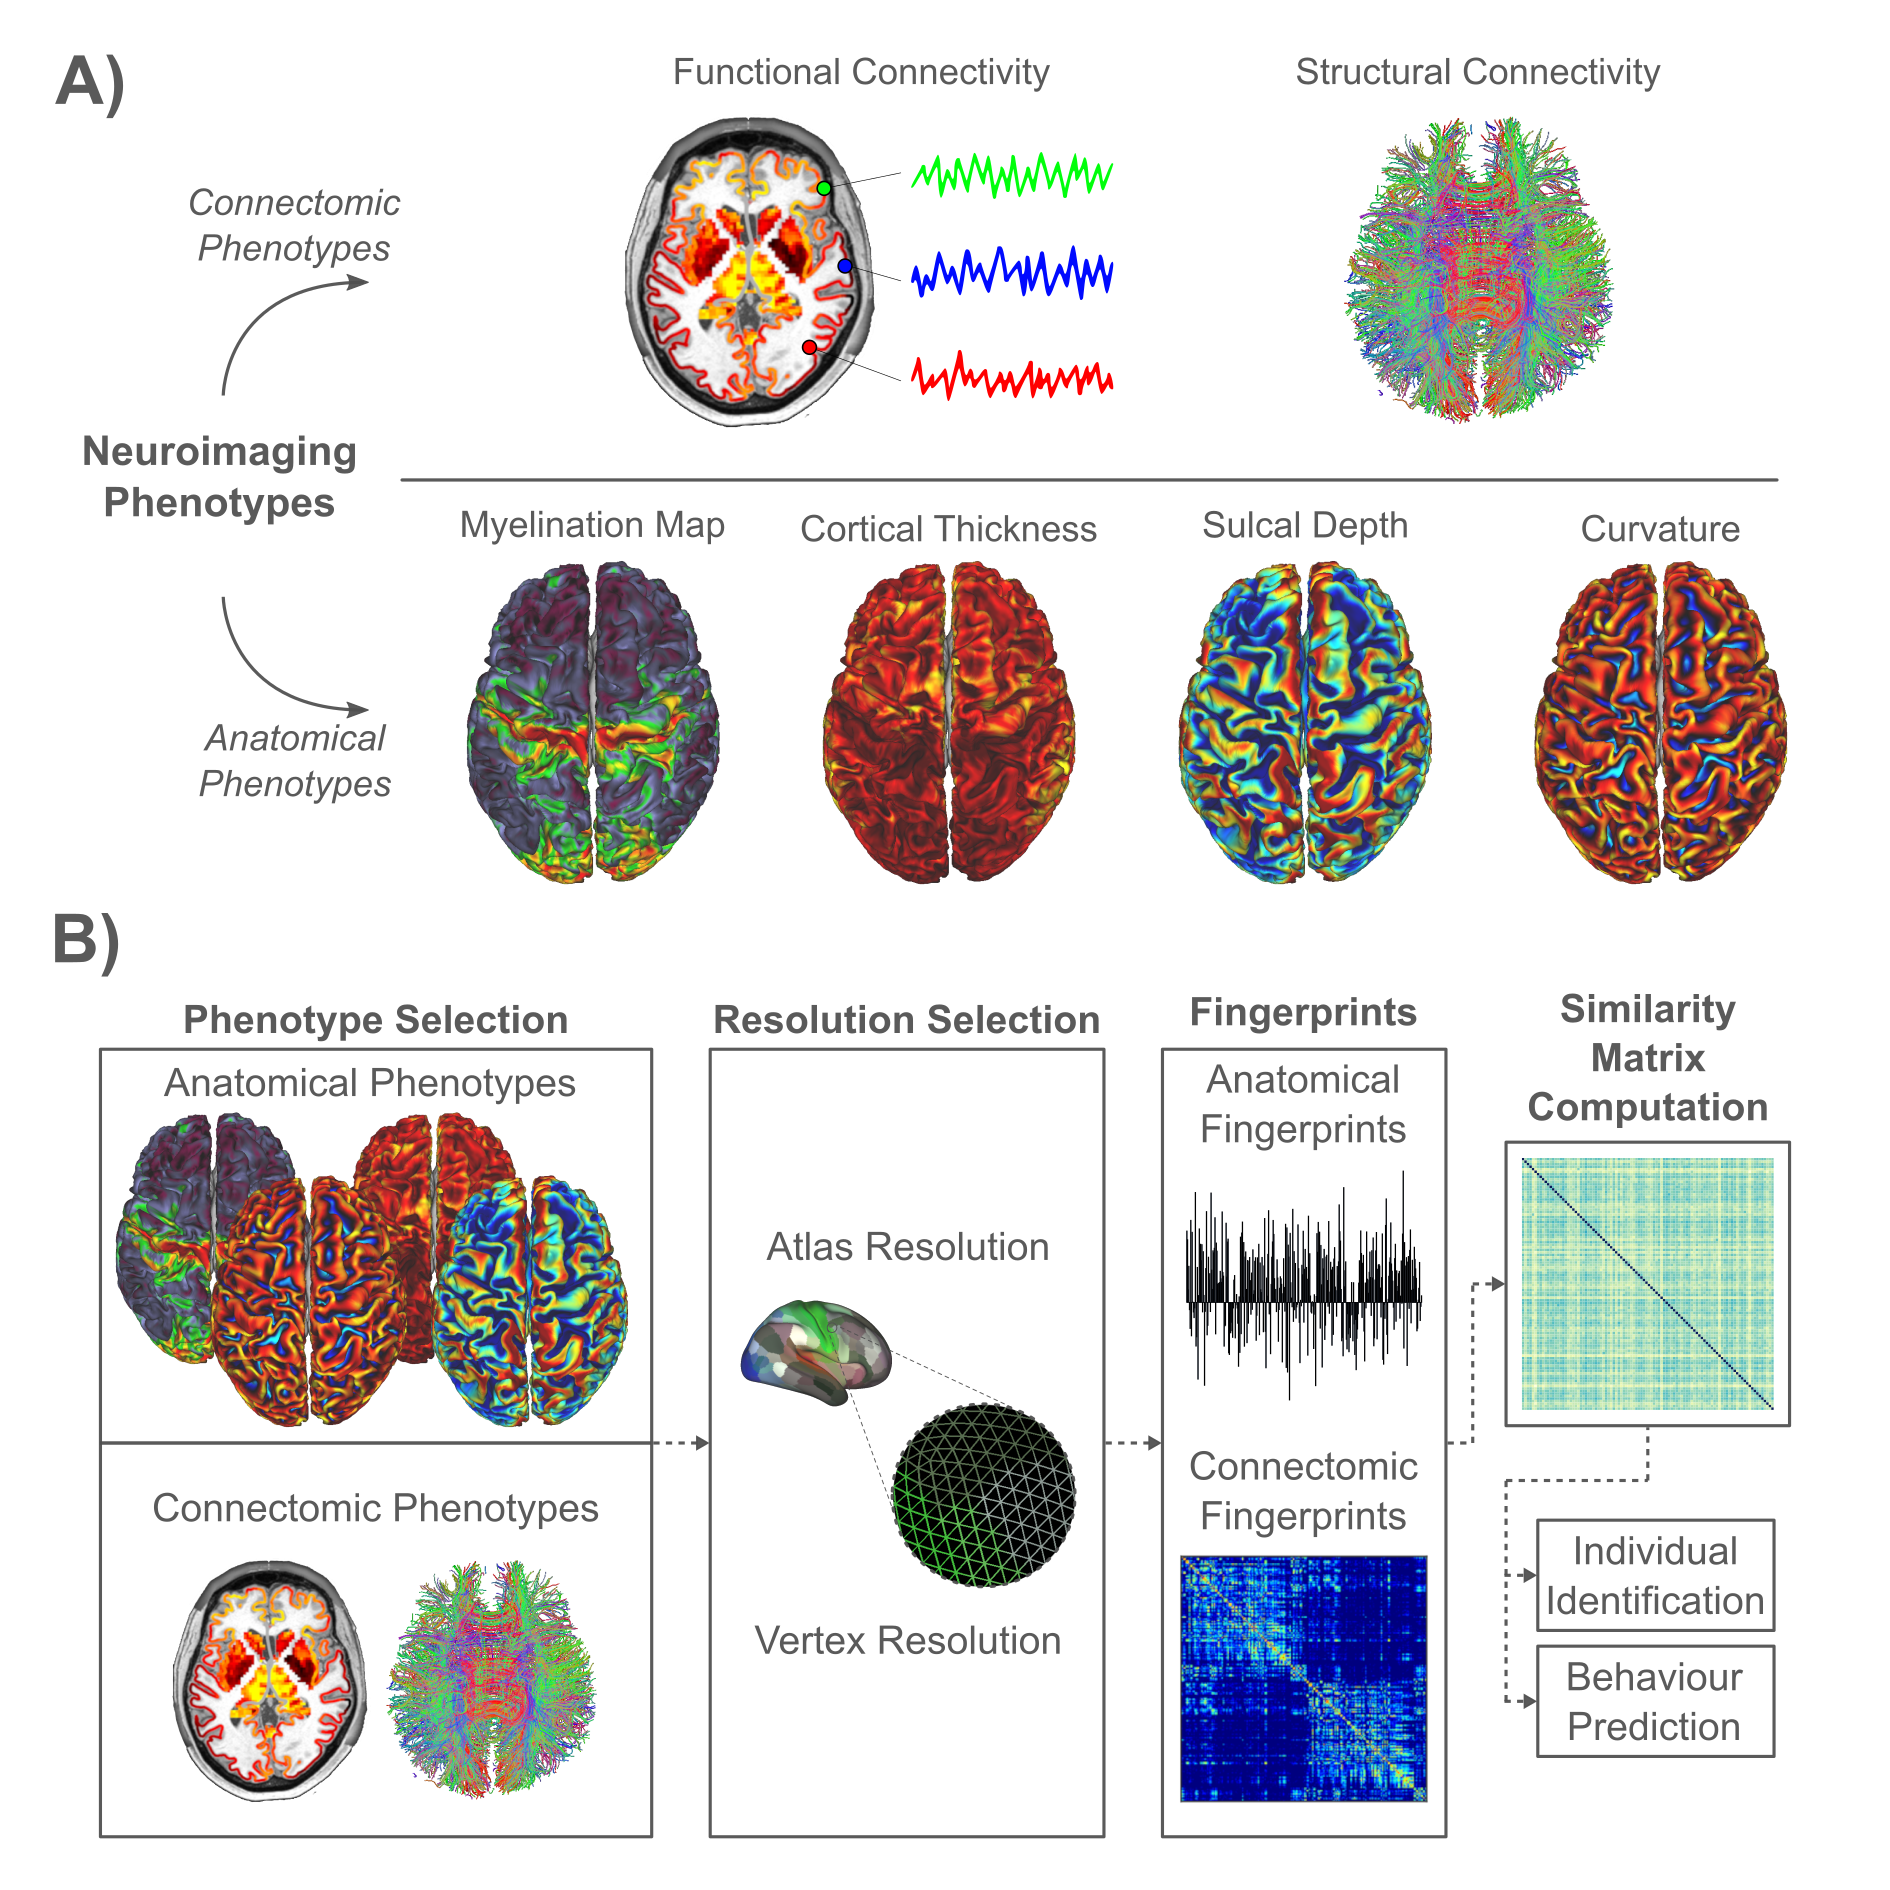
Figure 1: Study overview. A) Neuroimaging-derived phenotypes arranged according to cortical structure (bottom) and connectivity (top). B) Schematic of methodology. First, a neuroimaging-derived phenotype is selected. Second, the selected phenotype is either mapped at the resolution of voxels/vertices, or a regional atlas. Third, the selected phenotype is represented as a fingerprint for each individual. Finally, the similarity in fingerprints is computed between pairs of individuals. The similarity matrix is used for individual identification and behavior prediction.