Aline M. Thomas1,2, Peter A. Calabresi3,4, Michael T. McMahon1,5, Peter C.M. van Zijl1,5, and Jeff W.M. Bulte1,2
1Russell H. Morgan Department of Radiology and Radiological Science, Johns Hopkins University School of Medicine, Baltimore, MD, United States, 2Institute for Cell Engineering, Imaging Section and Vascular Biology Program, Johns Hopkins University School of Medicine, Baltimore, MD, United States, 3Department of Neurology, Johns Hopkins University School of Medicine, Baltimore, MD, United States, 4Solomon H. Snyder Department of Neuroscience, Johns Hopkins University School of Medicine, Baltimore, MD, United States, 5Department of Radiology, Kennedy Krieger Institute, Baltimore, MD, United States
1Russell H. Morgan Department of Radiology and Radiological Science, Johns Hopkins University School of Medicine, Baltimore, MD, United States, 2Institute for Cell Engineering, Imaging Section and Vascular Biology Program, Johns Hopkins University School of Medicine, Baltimore, MD, United States, 3Department of Neurology, Johns Hopkins University School of Medicine, Baltimore, MD, United States, 4Solomon H. Snyder Department of Neuroscience, Johns Hopkins University School of Medicine, Baltimore, MD, United States, 5Department of Radiology, Kennedy Krieger Institute, Baltimore, MD, United States
The potential of imaging disease-associated
lymph nodes to monitor MS progression was evaluated in a preclinical MS model.
Changes were observed using CEST MRI, but not conventional MRI.

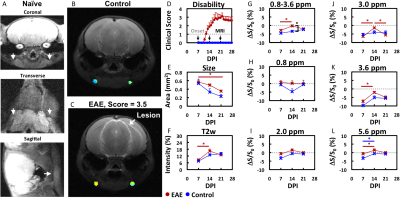
MRI of disease-associated LN in EAE. (A) T2-w MRI at multiple planes in a
naïve mouse. Arrows highlight LN location. (B, C) LN CEST signal (0.8-3.6 ppm) in (C) an EAE mouse and (B)
a control mouse. (E-K) Quantification
of MRI metrics 7-21 days PI as (D) disability progressed in EAE mice (red) compared to
control mice (blue): (E) size
(cross sectional area), (F) T2-w
intensity, and (G-L) CEST signal at
several commonly-investigated frequency ranges (±0.4 ppm). Arrow highlights a
T2-w hyperintense lesion. AVE±SEM. N=8 for EAE mice. N=4 for control. *p<0.05. LN=lymph node. PI=post induction.

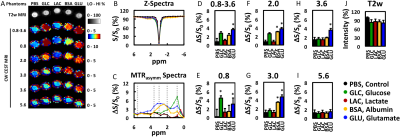
Sensitivity of CEST MRI to metabolites
altered in inflammatory lesions.
Visualization and quantification of (A-I)
CEST (ΔS/S0, %) at multiple frequencies of irradiation and (J) T2-w (intensity, %) signals of an agarose
gel (0.2%) containing metabolites (50 mM) compared to bovine serum albumin (5%)
and PBS alone (control). (B)
Z-spectra and (C) MTRasym
spectra. (D-I) CEST signal at
several commonly-investigated frequency ranges (±0.4 ppm). The frequencies are
highlighted with dashed lines in ‘C’. AVE±SEM. N=3. *p<0.05.
