Yi Wei1, Zheng Ye1, Hehan Tang1, Bin Song1, Xiaocheng Wei2, Lisha Nie2, and Hancheng Yang2
1West China Hospital, Sichuan University, Chengdu, China, 2GE Healthcare, MR Research, Beijing, China
1West China Hospital, Sichuan University, Chengdu, China, 2GE Healthcare, MR Research, Beijing, China
IVIM model–derived D value is superior to ADC measured with mono-exponential model for evaluating the MVI ofHCC. Among MR imaging features, tumor margin, enhancement pattern, tumor capsule, and peritumoral enhancement were notpredictive for MVI.
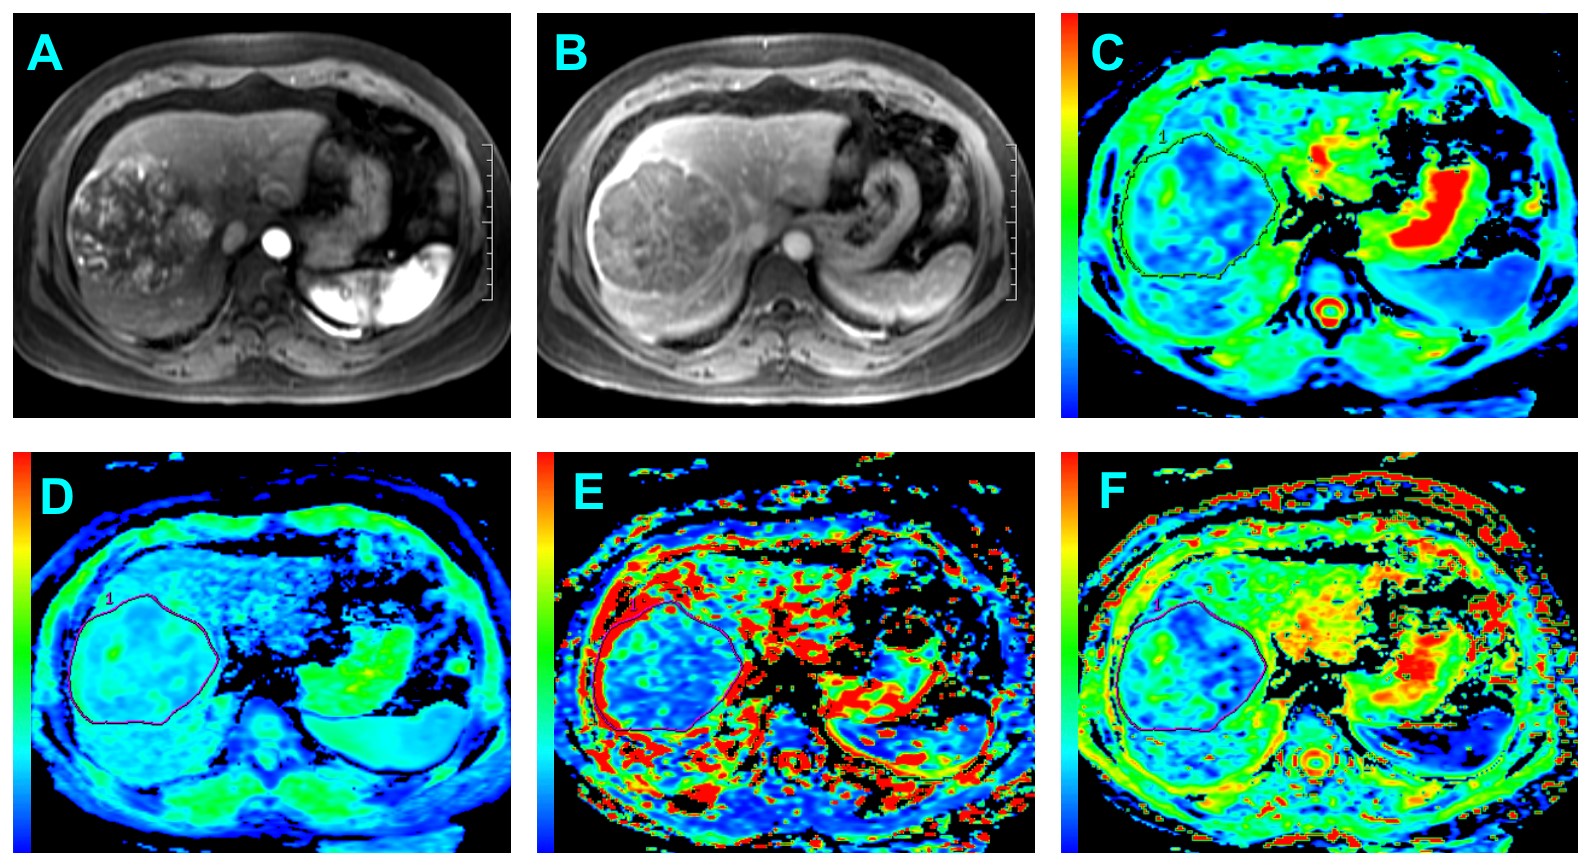
Figure 2: Surgically confirmed HCC with MVI in a 54-year old man. (A) Arterial phase image shows
a lobulated mass with heterogeneous enhancement followed by washout is seen in (B)
portal venous phase. (C) ADC map, ADC value for the lesion was 1.12☓10-3 mm2/s. (D)
ADCslow map, ADCslow value for the lesion was 0.80☓10-3 mm2/s.
(E) ADCfast map, ADCfast value for the lesion was 9.55☓10-3 mm2/s. (F)
f map, f value was 0.237☓100%. ADC and ADCslow map shows a slightly
higher signal intensity compared with that of liver parenchyma.
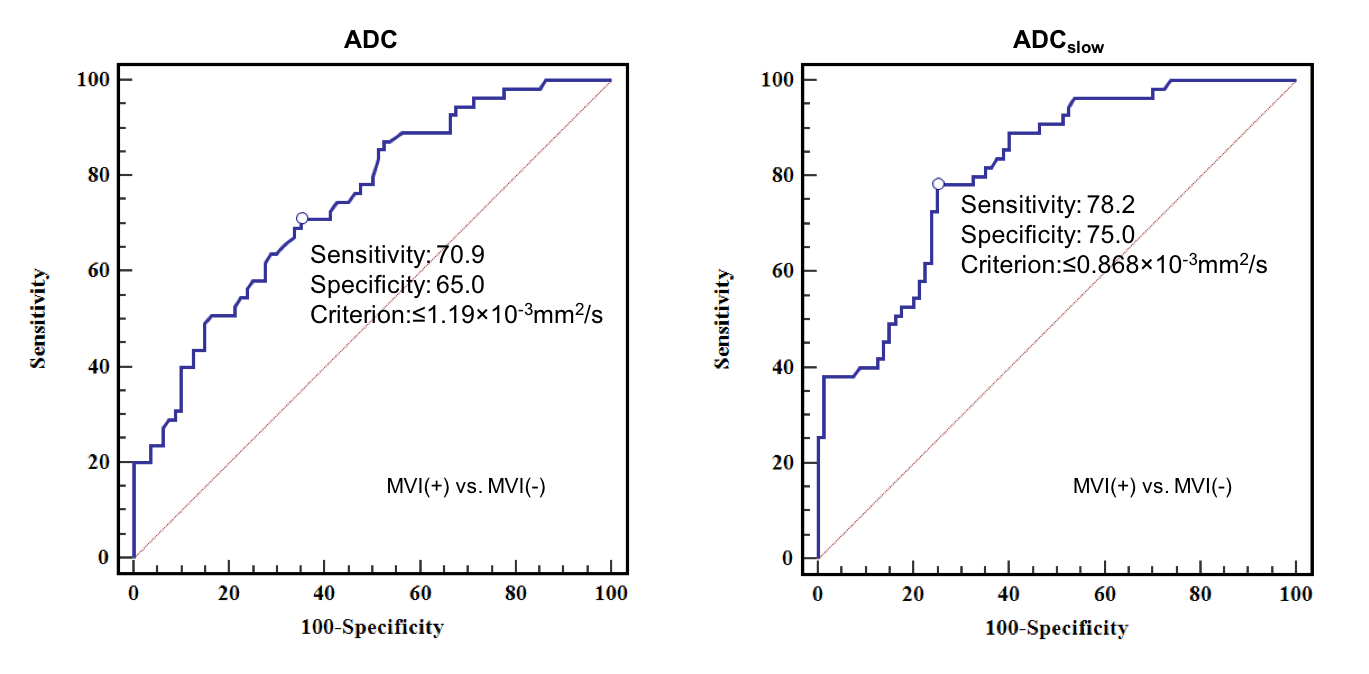
Figure 3: ROC curves of ADC and ADCslow to distinguish
MVI-Positive and MVI-Negative HCCs. AUC value of ADC was 0.746 (95% CI: 0.664-0.817)
with the optimal cutoff value of 1.19☓10-3 mm2/s, AUC value of ADCslow
was 0.815 (95% CI: 0.740-0.877) with the optimal cutoff value of 0.868☓10-3 mm2/s.