Fei Wang1, Yupei Zhang1, Mengxiao Liu2, and Juan Zhu1
1Department of MRI,AnQing Municipal Hospital, Anqing, China, 2MR scientific Marketing, Diagnostic Imaging, Siemens Healthcare Ltd, Shanghai, China
1Department of MRI,AnQing Municipal Hospital, Anqing, China, 2MR scientific Marketing, Diagnostic Imaging, Siemens Healthcare Ltd, Shanghai, China
T1-mapping technology for differential diagnosis of hepatic cyst,hemangioma and HCC provides a new quantitative method, especially for no-enhanced
T1-mapping, have promise of clinical application.
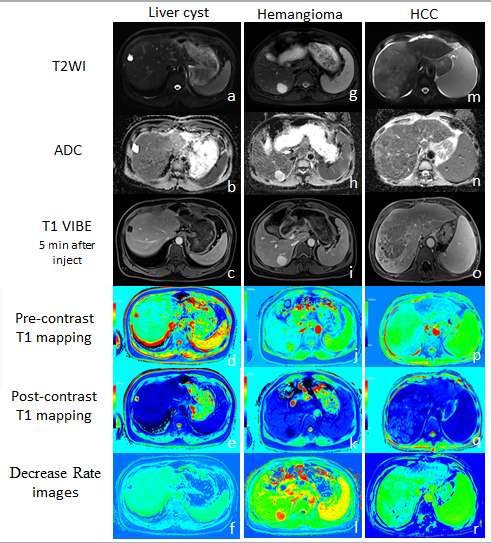
Figure 1. (a~f) Liver
cyst. appeared hyperintensity on
T2WI-fs and hypointensity on
contrast image, ADC value 2.81×10⁻³mm2/s, pre-contrast T1=3125ms, post-contrast
T1=2800ms, decrease rate of T1 = 10.4%.
(g~l) Hemangioma.
appeared hyperintensity on
both T2WI-fs and contrast image. ADC value 1.53×10⁻³mm2/s,
pre-contrast T1=1828ms, post-contrast T1=210ms, decrease
rate of T1 = 88.5%.
(m~r) HCC.
appeared hypointensity on
both T2WI-fs and delayed contrast
image.
ADC value 0.95×10⁻³mm2/s,
pre-contrast T1=1208ms, post-contrast T1=530ms, decrease
rate of T1 = 56.1%
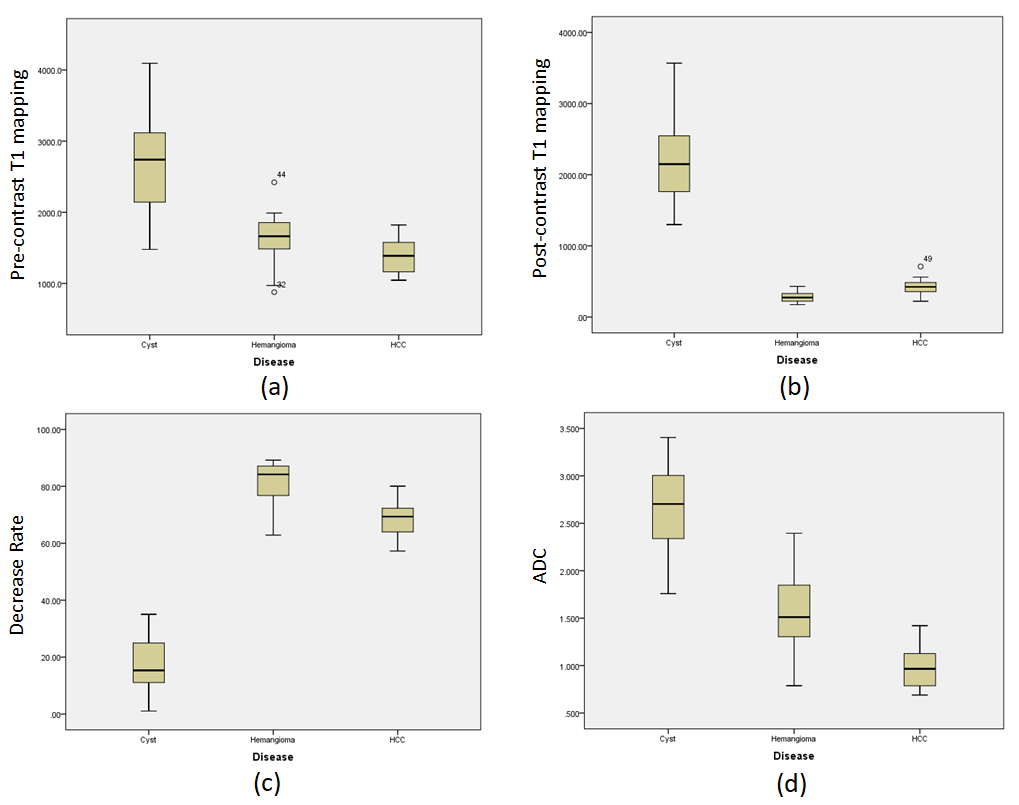
Figure 2. Boxplots of pre-
and post-contrast
T1 value,
decrease rate
and
ADC value