Deep B. Gandhi1, Jonathan Dudley1, Ruchi Singh2, Jean A. Tkach1, Divya Sharma3, Amy Taylor2, Alexander G. Miethke2, and Jonathan R. Dillman1
1Imaging Research Center, Department of Radiology, Cincinnati Children's Hospital Medical Center, Cincinnati, OH, United States, 2Division of Hepatology, Gastroenterology and Nutrition, Cincinnati Children's Hospital Medical Center, Cincinnati, OH, United States, 3Department of Pathology and Laboratory Medicine, University of Cincinnati Medical Center, Cincinnati, OH, United States
1Imaging Research Center, Department of Radiology, Cincinnati Children's Hospital Medical Center, Cincinnati, OH, United States, 2Division of Hepatology, Gastroenterology and Nutrition, Cincinnati Children's Hospital Medical Center, Cincinnati, OH, United States, 3Department of Pathology and Laboratory Medicine, University of Cincinnati Medical Center, Cincinnati, OH, United States
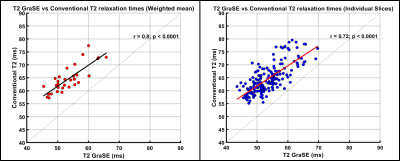
Significant positive correlations were observed between GraSE and conventional liver T2 measurements for the weighted mean (r=0.80; p<0.01) and for individual
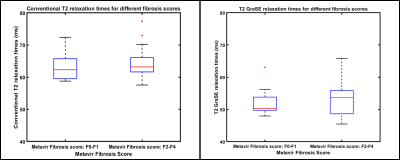
slices (r=0.72; p<0.01). No significant correlation was observed between
liver T2 measurements and histologic fibrosis stage.


