Adrienne E Campbell-Washburn1, Christine Mancini1, Anna Conrey1, Lanelle Edwards1, Hui Xue1, Peter Kellman1, W. Patricia Bandettini1, and Swee Lay Thein1
1National Heart, Lung, and Blood Institute, National Institutes of Health, Bethesda, MD, United States
1National Heart, Lung, and Blood Institute, National Institutes of Health, Bethesda, MD, United States
In this study, we show larger dynamic range of hepatic T2* values using a high-performance 0.55T, compared to 1.5T, which may be valuable to stratify patients with severe iron overload.
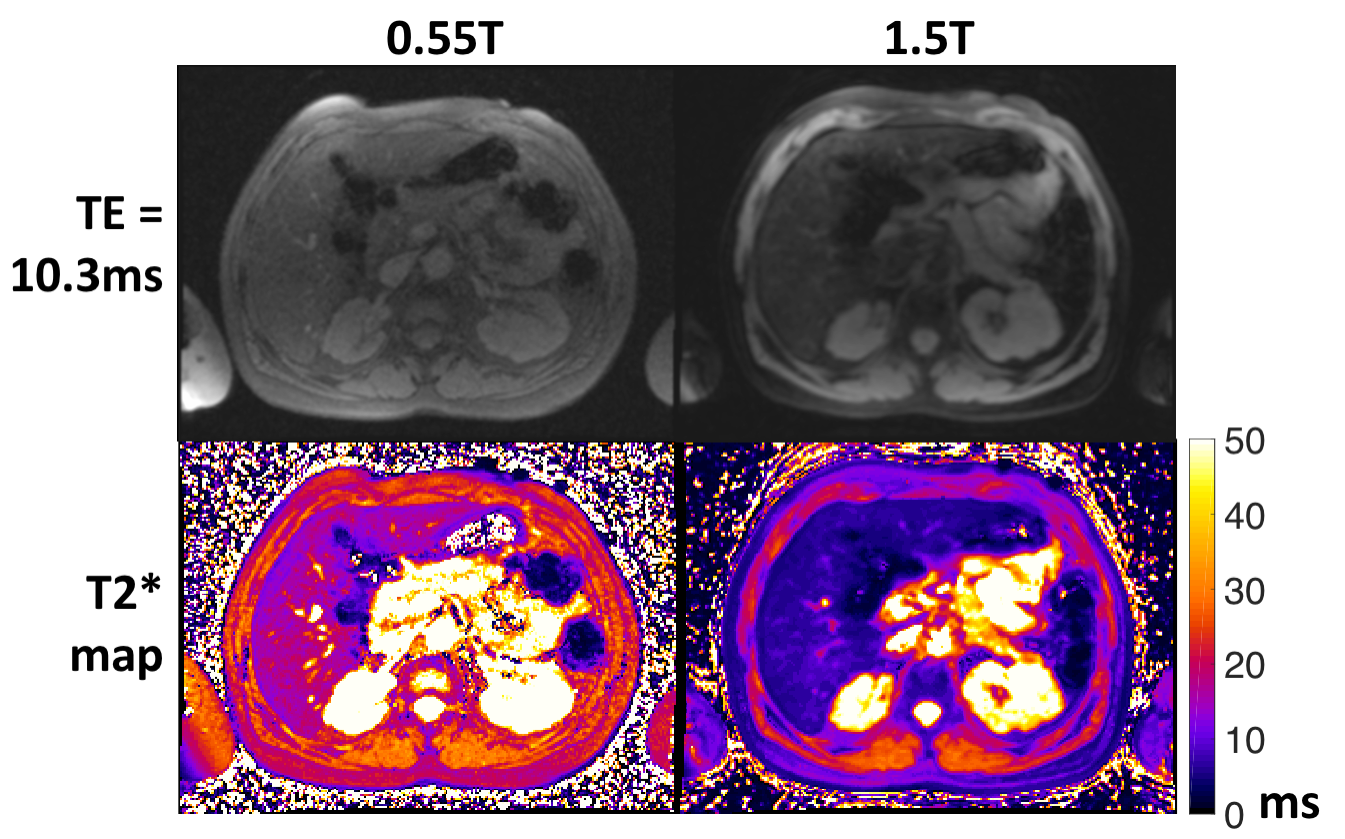
Figure 4: T2*-weighted images (TE= 10.3ms) and T2* maps from 0.55T and 1.5T.
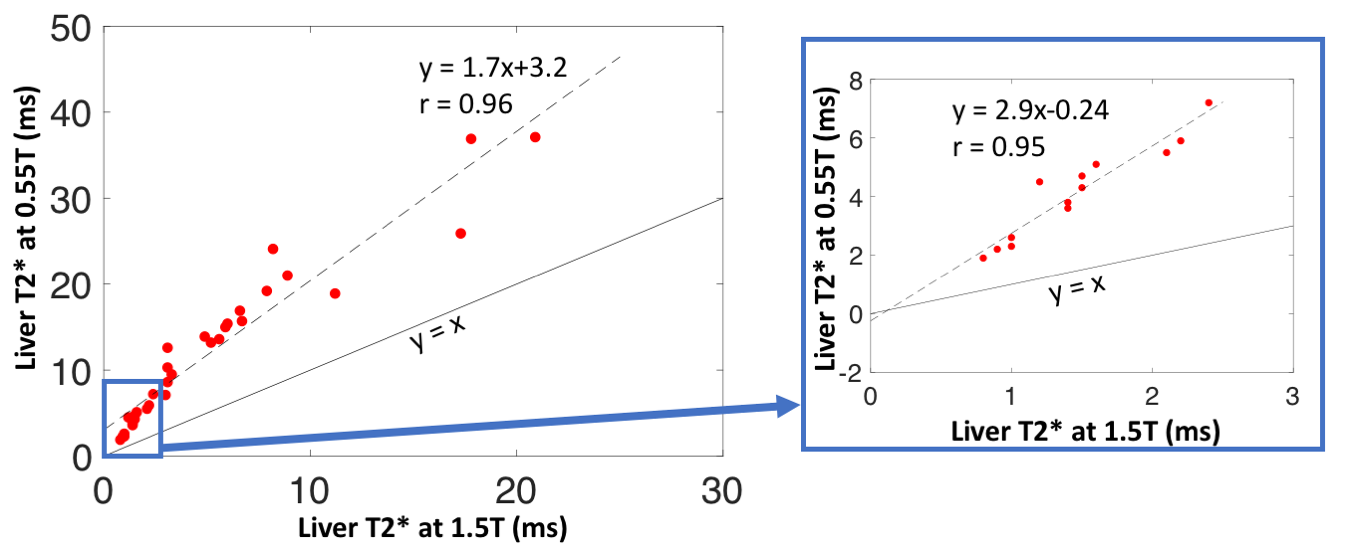
Figure 3: Liver T2* measured at 0.55T and 1.5T in patients with iron overload (n = 34). The blue box highlights patients with moderate to severe iron overload with T2*<3ms at 1.5T. Larger dynamic range at 0.55T for patients with severe iron overload was observed.