Arnold Julian Vinoj Benjamin1, Mary A McClean1, Joshua D Kaggie1, Lucian Beer1, Frank Riemer2, Rolf F Schulte3, Titus Lanz4, Martin J Graves5, and Ferdia A Gallagher1
1Department of Radiology, University of Cambridge, Cambridge, United Kingdom, 2Department of Radiology, Haukeland University Hospital, Bergen, Norway, 3GE Global Research, Munich, Germany, 4RAPID Biomedical GmbH, Rimpar, Germany, 5Department of Radiology, Cambridge University Hospitals NHS Foundation Trust, Cambridge, United Kingdom
1Department of Radiology, University of Cambridge, Cambridge, United Kingdom, 2Department of Radiology, Haukeland University Hospital, Bergen, Norway, 3GE Global Research, Munich, Germany, 4RAPID Biomedical GmbH, Rimpar, Germany, 5Department of Radiology, Cambridge University Hospitals NHS Foundation Trust, Cambridge, United Kingdom
Sodium T2* values can be used to study several disease processes such as chronic kidney
disease (CKD) and tumors which are subject to the blood oxygenation level dependant (BOLD)
effect. As sodium is a major component of the blood, blood oxygenation may directly affect the sodium T2* values.
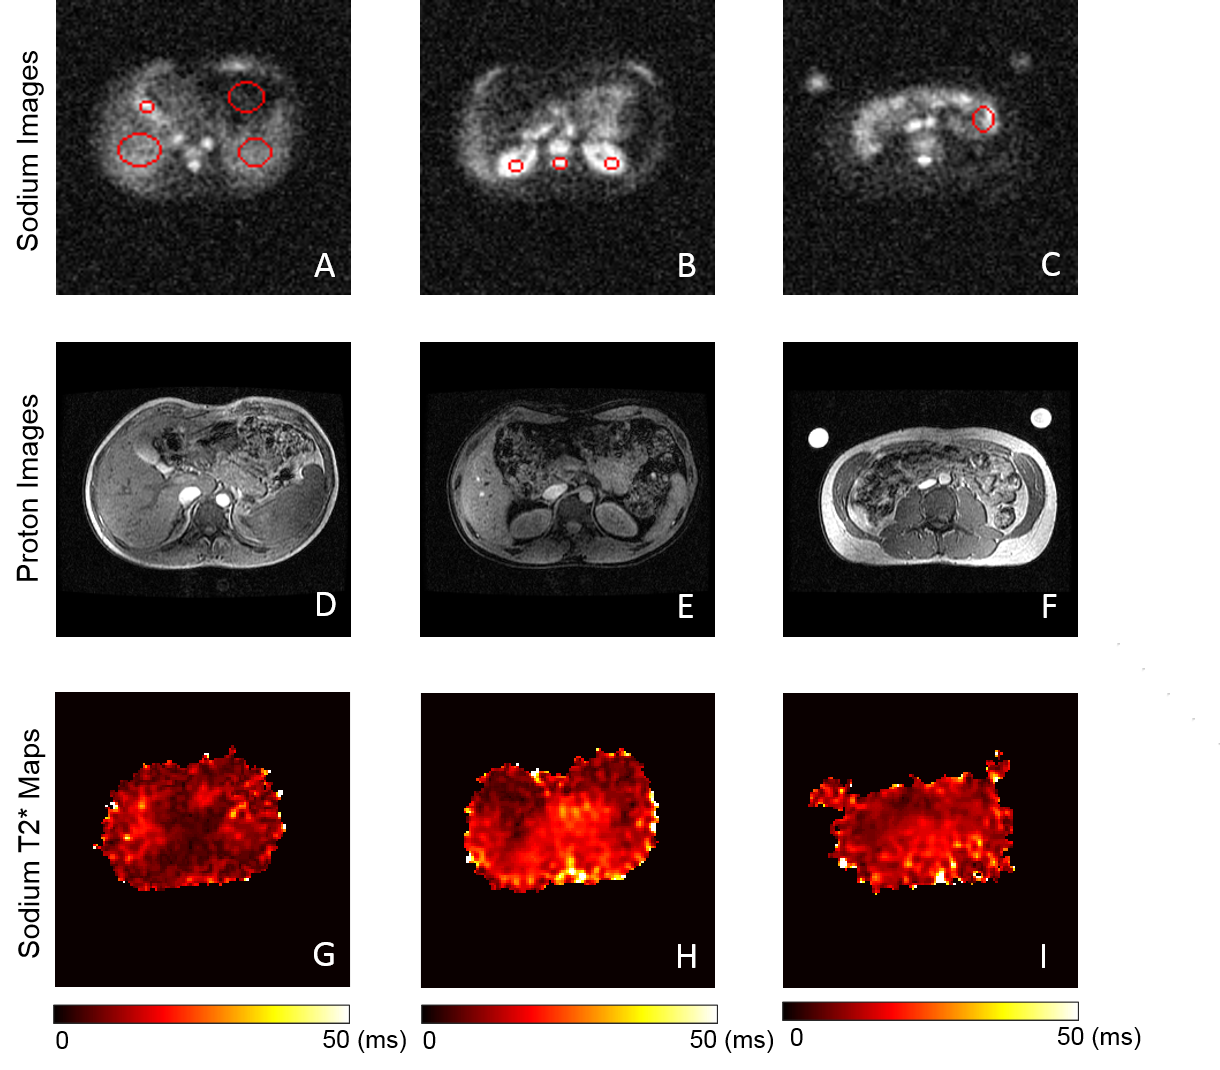
Figure 2: (A-C) Three axial 23Na images of a
healthy volunteer (volunteer 1). (D-F) Corresponding proton images of the same
volunteer. (G-I) 23Na T2* maps of the three axial slices.
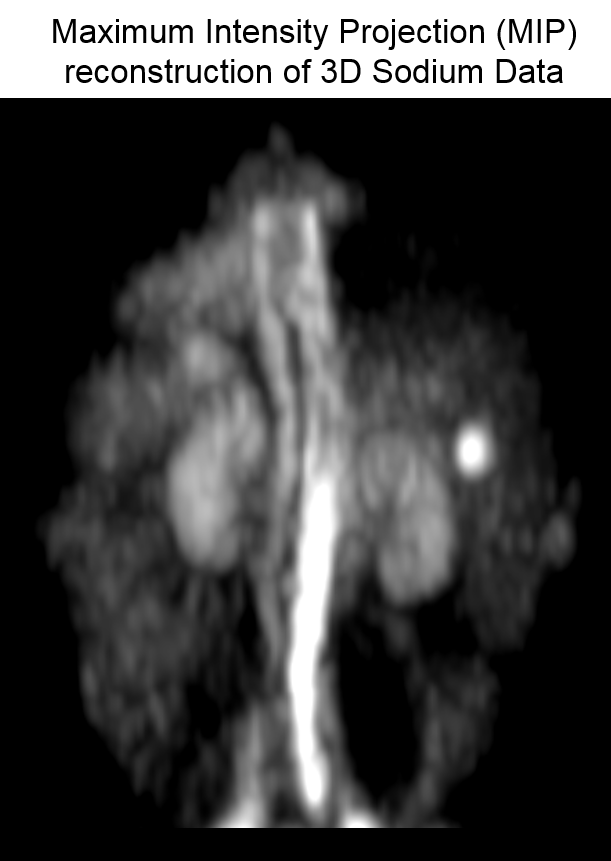
Figure 1: Maximum Intensity Projection (MIP)
reconstruction of the 23Na 3D data of a healthy volunteer (volunteer
2). The kidneys (asterisk) and spinal cord (arrow) demonstrate increased signal
due to the high fluid content of these organs. Sodium phantom (arrowhead) was
used for calculating total sodium concentrations (TSC) in the abdomen.