Ying Li1, Cuiping Ren1, Jingliang Cheng1, Jinxia Zhu2, and Stephan Kannengiesser3
1MRI, The first affiliated hospital of Zhengzhou university, Zhengzhou, China, 2MR Collaboration, Siemens Healthcare Ltd., Beijing, China, 3Siemens Healthcare GmbH, Erlangen, Germany
1MRI, The first affiliated hospital of Zhengzhou university, Zhengzhou, China, 2MR Collaboration, Siemens Healthcare Ltd., Beijing, China, 3Siemens Healthcare GmbH, Erlangen, Germany
This work investigated and evaluated the role of the quantitative Dixon sequence in predicting the bone marrow fat on the lumbar spine, which might provide quantitative imaging parameters for accurately predicting fracture risk in patients with osteoporosis.

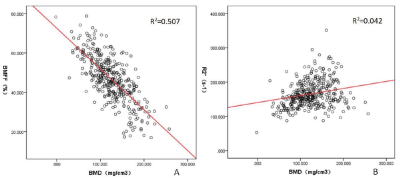
Figure 3: Scatterplot showing negative correlation between BMFF and BMD (A), as well as the positivecorrelation between the R2* values and BMD (B) (R2 = 0.507; P < 0.001; R2 = 0.042; P < 0.001,respectively).

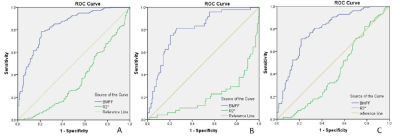
Figure 2.A: The AUCs of BMFF and R2* were 0.835 and 0.352, respectively, for distinguishing abnormalbone density (i.e., osteopenia and osteoporosis) from normal bone density.B: The AUCs of BMFF and R2* were 0.803 and 0.212, respectively, for distinguishing osteoporosisfrom osteopenia.C: The ROC analysis showed that the AUCs of BMFF and R2* were 0.790 and 0.418, respectively,for distinguishing osteopenia from normal bone density.