Jason Graham Skinner1, Geoffrey Topping1, Irina Heid2, Maximilian Aigner1, Martin Grashei1, Christian Hundshammer1, Lukas Kritzner2, Frits Hendrik Anton van Heijster1, Tim Wartewig3,4, Erik Hameister3,4, Jürgen Ruland3,4,5,6, Rickmer Braren2, and Franz Schilling1
1Nuclear Medicine, Klinikum rechts der Isar, The Technical University of Munich, Munich, Germany, 2Institute of Radiology, Klinikum rechts der Isar, The Technical University of Munich, Munich, Germany, 3Institute for Clinical Chemistry and Pathobiochemistry, Klinikum rechts der Isar, The Technical University of Munich, Munich, Germany, 4TranslaTUM, Center for Translational Cancer Research, The Technical University of Munich, Munich, Germany, 5German Cancer Consortium (DKTK), Heidelberg, Germany, 6German Center for Infection Research (DZIF), Munich, Germany
1Nuclear Medicine, Klinikum rechts der Isar, The Technical University of Munich, Munich, Germany, 2Institute of Radiology, Klinikum rechts der Isar, The Technical University of Munich, Munich, Germany, 3Institute for Clinical Chemistry and Pathobiochemistry, Klinikum rechts der Isar, The Technical University of Munich, Munich, Germany, 4TranslaTUM, Center for Translational Cancer Research, The Technical University of Munich, Munich, Germany, 5German Cancer Consortium (DKTK), Heidelberg, Germany, 6German Center for Infection Research (DZIF), Munich, Germany
A fast, spectrally
selective 3D bSSFP sequence was developed for preclinical metabolic imaging of
hyperpolarized 13C agents at 7 T. High resolution 3D images were
produced in healthy mice and two models of cancer. Using 900 Hz FHWM pulses, 1.75
mm3 isotropic images were obtained.

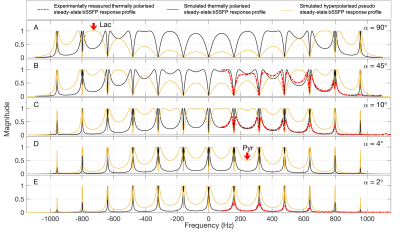
Simulated (solid
lines) and experimentally measured (dashed lines) bSSFP steady-state response
profiles. Simulation parameters: TR = 6.269 ms, RF FWHM = 900 Hz, thermal
(black line) T1 = 1025.06 ms, T2 = 390.0 ms, ‘hyperpolarised’
(orange line) T1 = 30 s, T2 = 350
ms. Passband width is equal to 1/TR (= 159.52 Hz). Red arrows indicate the
positions of the lactate and pyruvate resonances relative to the RF excitation
in the highest resolution experiments that were performed (1.75 mm3 - Fig. 4).
A clear dependence of the bSSFP response profile on TR, T1, T2
and α is apparent.

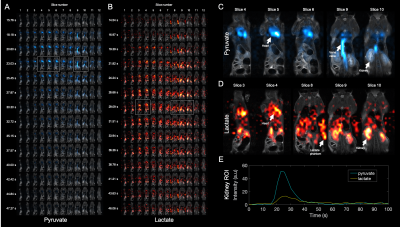
Spectrally selective (900
Hz FWHM) 3D bSSFP in a healthy mouse. Per-metabolite scantime = 1.212 s, TR =
6.29 ms, resolution = 1.75 mm3. All 13C images are
overlaid on T2w RARE 1H anatomical images. A&B show all 12
slices of the 13C images for 14 timepoints for pyruvate (α=4°, bSSFP lobe 2) and lactate (α=90°, bSSFP lobe 5) respectively. C&D are select
images from A&B indicated by the white boxes. Vasculature, heart and
kidneys are clearly visualized in both metabolites. The lactate phantom is
visible in D&B slice 8 and absent in A slice 8. E shows metabolite signal
dynamics in the marked kidney.
