Mathilde Ripart1,2, Vincent Gras1, Rachida Elamrani1, Lucie Hertz-Pannier1, and Alexandre Vignaud1
1CEA, Neurospin, Université Paris-Saclay, Gif-sur-Yvette, France, 2Centrale Lyon, Ecully, France
1CEA, Neurospin, Université Paris-Saclay, Gif-sur-Yvette, France, 2Centrale Lyon, Ecully, France
Simulations of the T1w/T2w ratio as a function of B1+ inhomogeneities present strong bias in the contrast, particularly on cortical areas of the brain. At 3T, only ¾ of the brain provides acceptable contrast bias (≤5%). This area is reduced by half at 7T, making the T1w/T2w unreliable at this field.
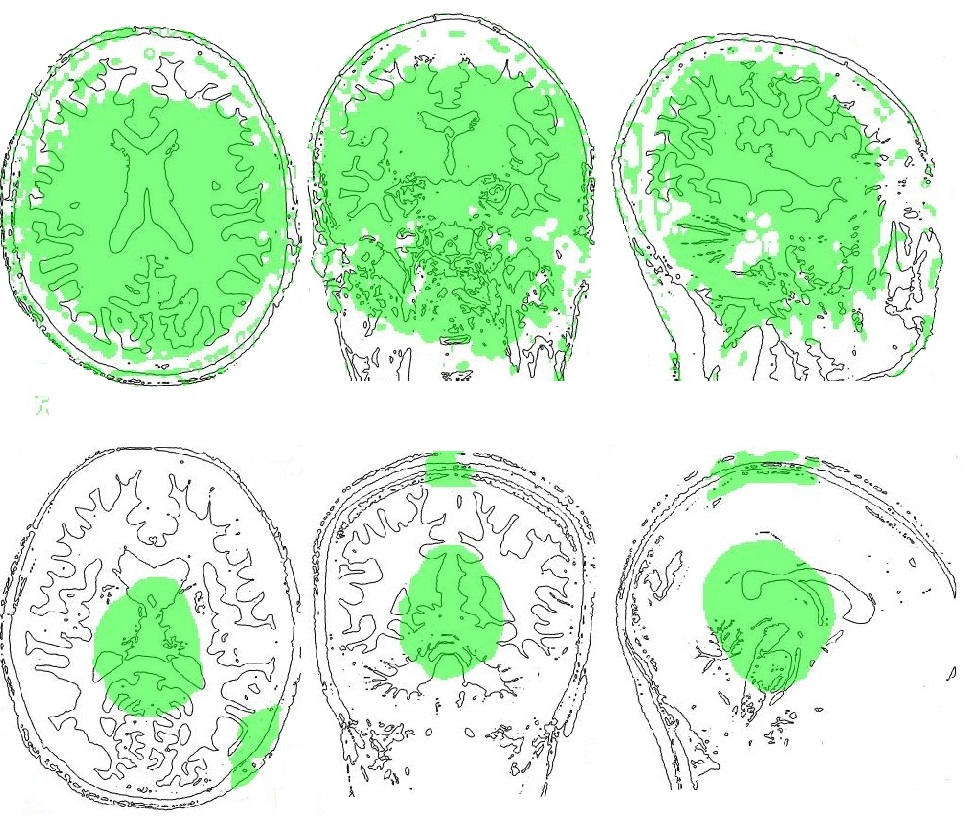
Figure 3: The range of acceptable B1+ inhomogeneities (green zone) translated on anatomical views of brains at 3T (top) and 7T (bottom).
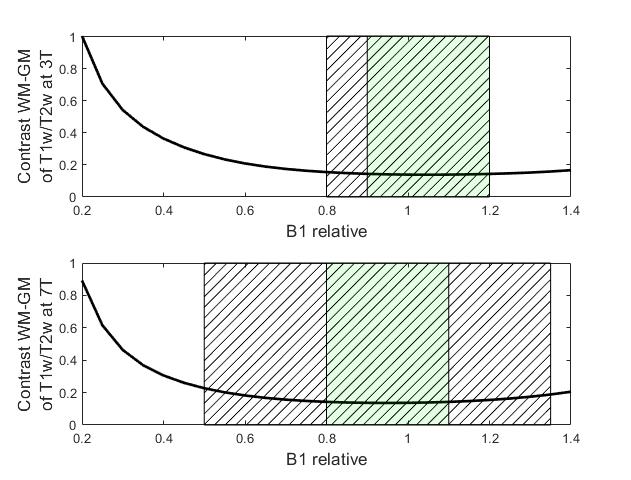
Figure 2: Simulation of the contrast WM-GM of the ratio T1w/T2w for variations of the flip angles going from 0.2 to 1.4 the nominal value. The hatched area corresponds to the range of B1+ inhomogeneities variations in the human brain at 3T and 7T. The green area corresponds to the range of relative flip angles that induce a bias in the contrast less than 5%.