Jae-Hyuk Shim1 and Hyeon-Man Baek1
1Gachon University, Incheon, Republic of Korea
1Gachon University, Incheon, Republic of Korea
Basal ganglia is automatically segmented using 3T and 7T HCP preprocessed images. Interconnectivity of segmented basal ganglia are compared between 3T and 7T diffusion-weighted images.
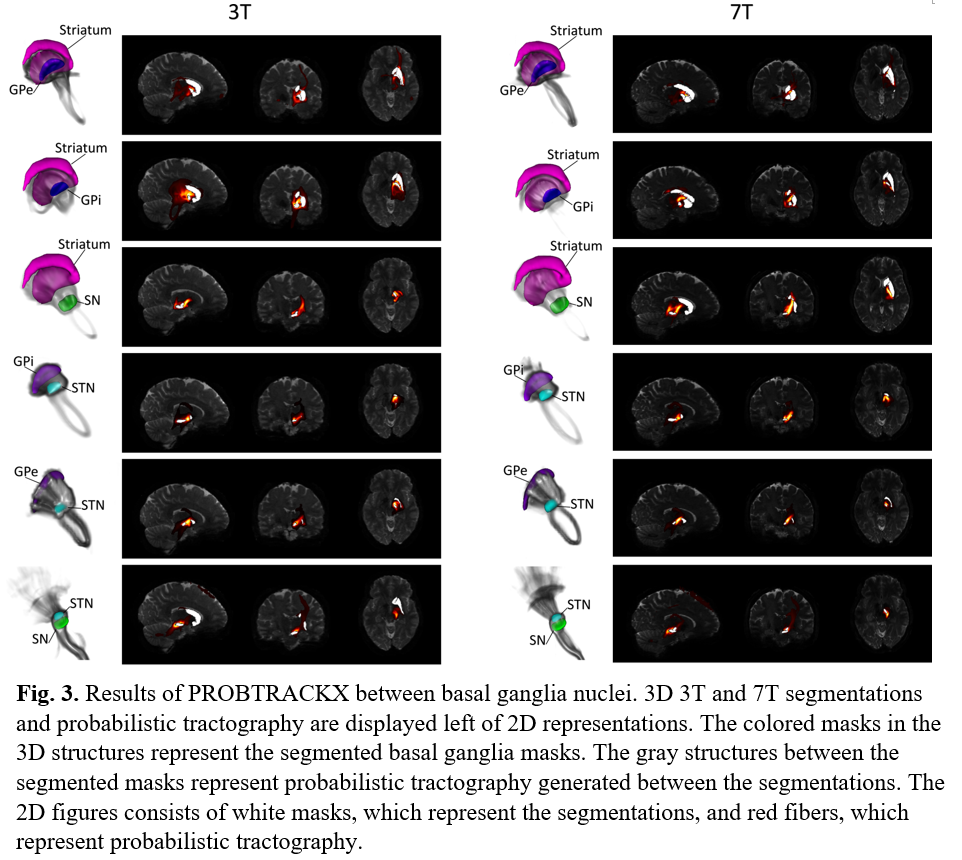
Fig.
3. Results
of PROBTRACKX between basal ganglia nuclei. 3D 3T and 7T segmentations and
probabilistic tractography are displayed left of 2D representations. The
colored masks in the 3D structures represent the segmented basal ganglia masks.
The gray structures between the segmented masks represent probabilistic
tractography generated between the segmentations. The 2D figures consists of
white masks, which represent the segmentations, and red fibers, which represent
probabilistic tractography.
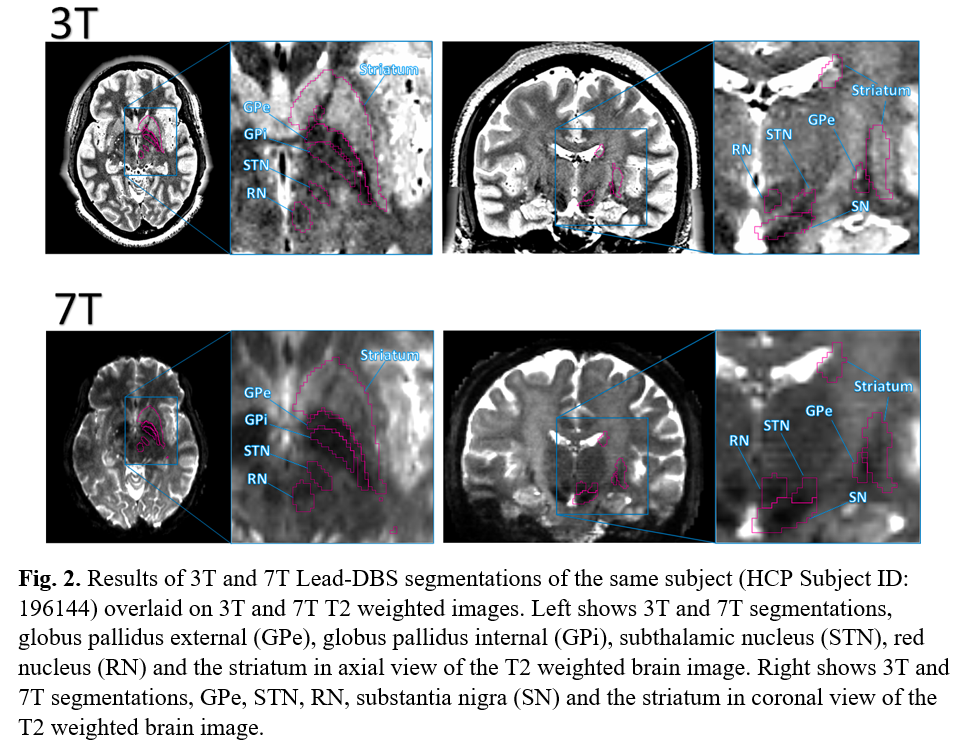
Fig.
2. Results
of 3T and 7T Lead-DBS segmentations of the same subject (HCP Subject ID:
196144) overlaid on 3T and 7T T2 weighted images. Left shows 3T and 7T
segmentations, globus pallidus external (GPe), globus pallidus internal (GPi),
subthalamic nucleus (STN), red nucleus (RN) and the striatum in axial view of
the T2 weighted brain image. Right shows 3T and 7T segmentations, GPe, STN, RN,
substantia nigra (SN) and the striatum in coronal view of the T2 weighted brain
image.