Serafeim Loukas1,2, Sandra Martin1, Joana Sa de Almeida1, Lana Vasung1,3, Dimitri Van De Ville2, Djalel Meskaldji1,4, and Petra S. Hüppi1
1Division of Development and Growth, Department of Pediatrics, University of Geneva, Geneva, Switzerland, 2Institute of Bioengineering, Ecole Polytechnique Fédérale de Lausanne (EPFL), Lausanne, Switzerland, 3Division of Newborn Medicine, Department of Medicine, Harvard Medical School, Boston, MA, United States, 4Institute of Mathematics, Ecole Polytechnique Fédérale de Lausanne (EPFL), Lausanne, Switzerland
1Division of Development and Growth, Department of Pediatrics, University of Geneva, Geneva, Switzerland, 2Institute of Bioengineering, Ecole Polytechnique Fédérale de Lausanne (EPFL), Lausanne, Switzerland, 3Division of Newborn Medicine, Department of Medicine, Harvard Medical School, Boston, MA, United States, 4Institute of Mathematics, Ecole Polytechnique Fédérale de Lausanne (EPFL), Lausanne, Switzerland
We explored spatio-temporal gene expression as well as rs-fMRI connectivity patterns in preterm newborns. We observe an important role of the somatosensory and motor cortices that might be linked to specific gene expressions in the same regions.
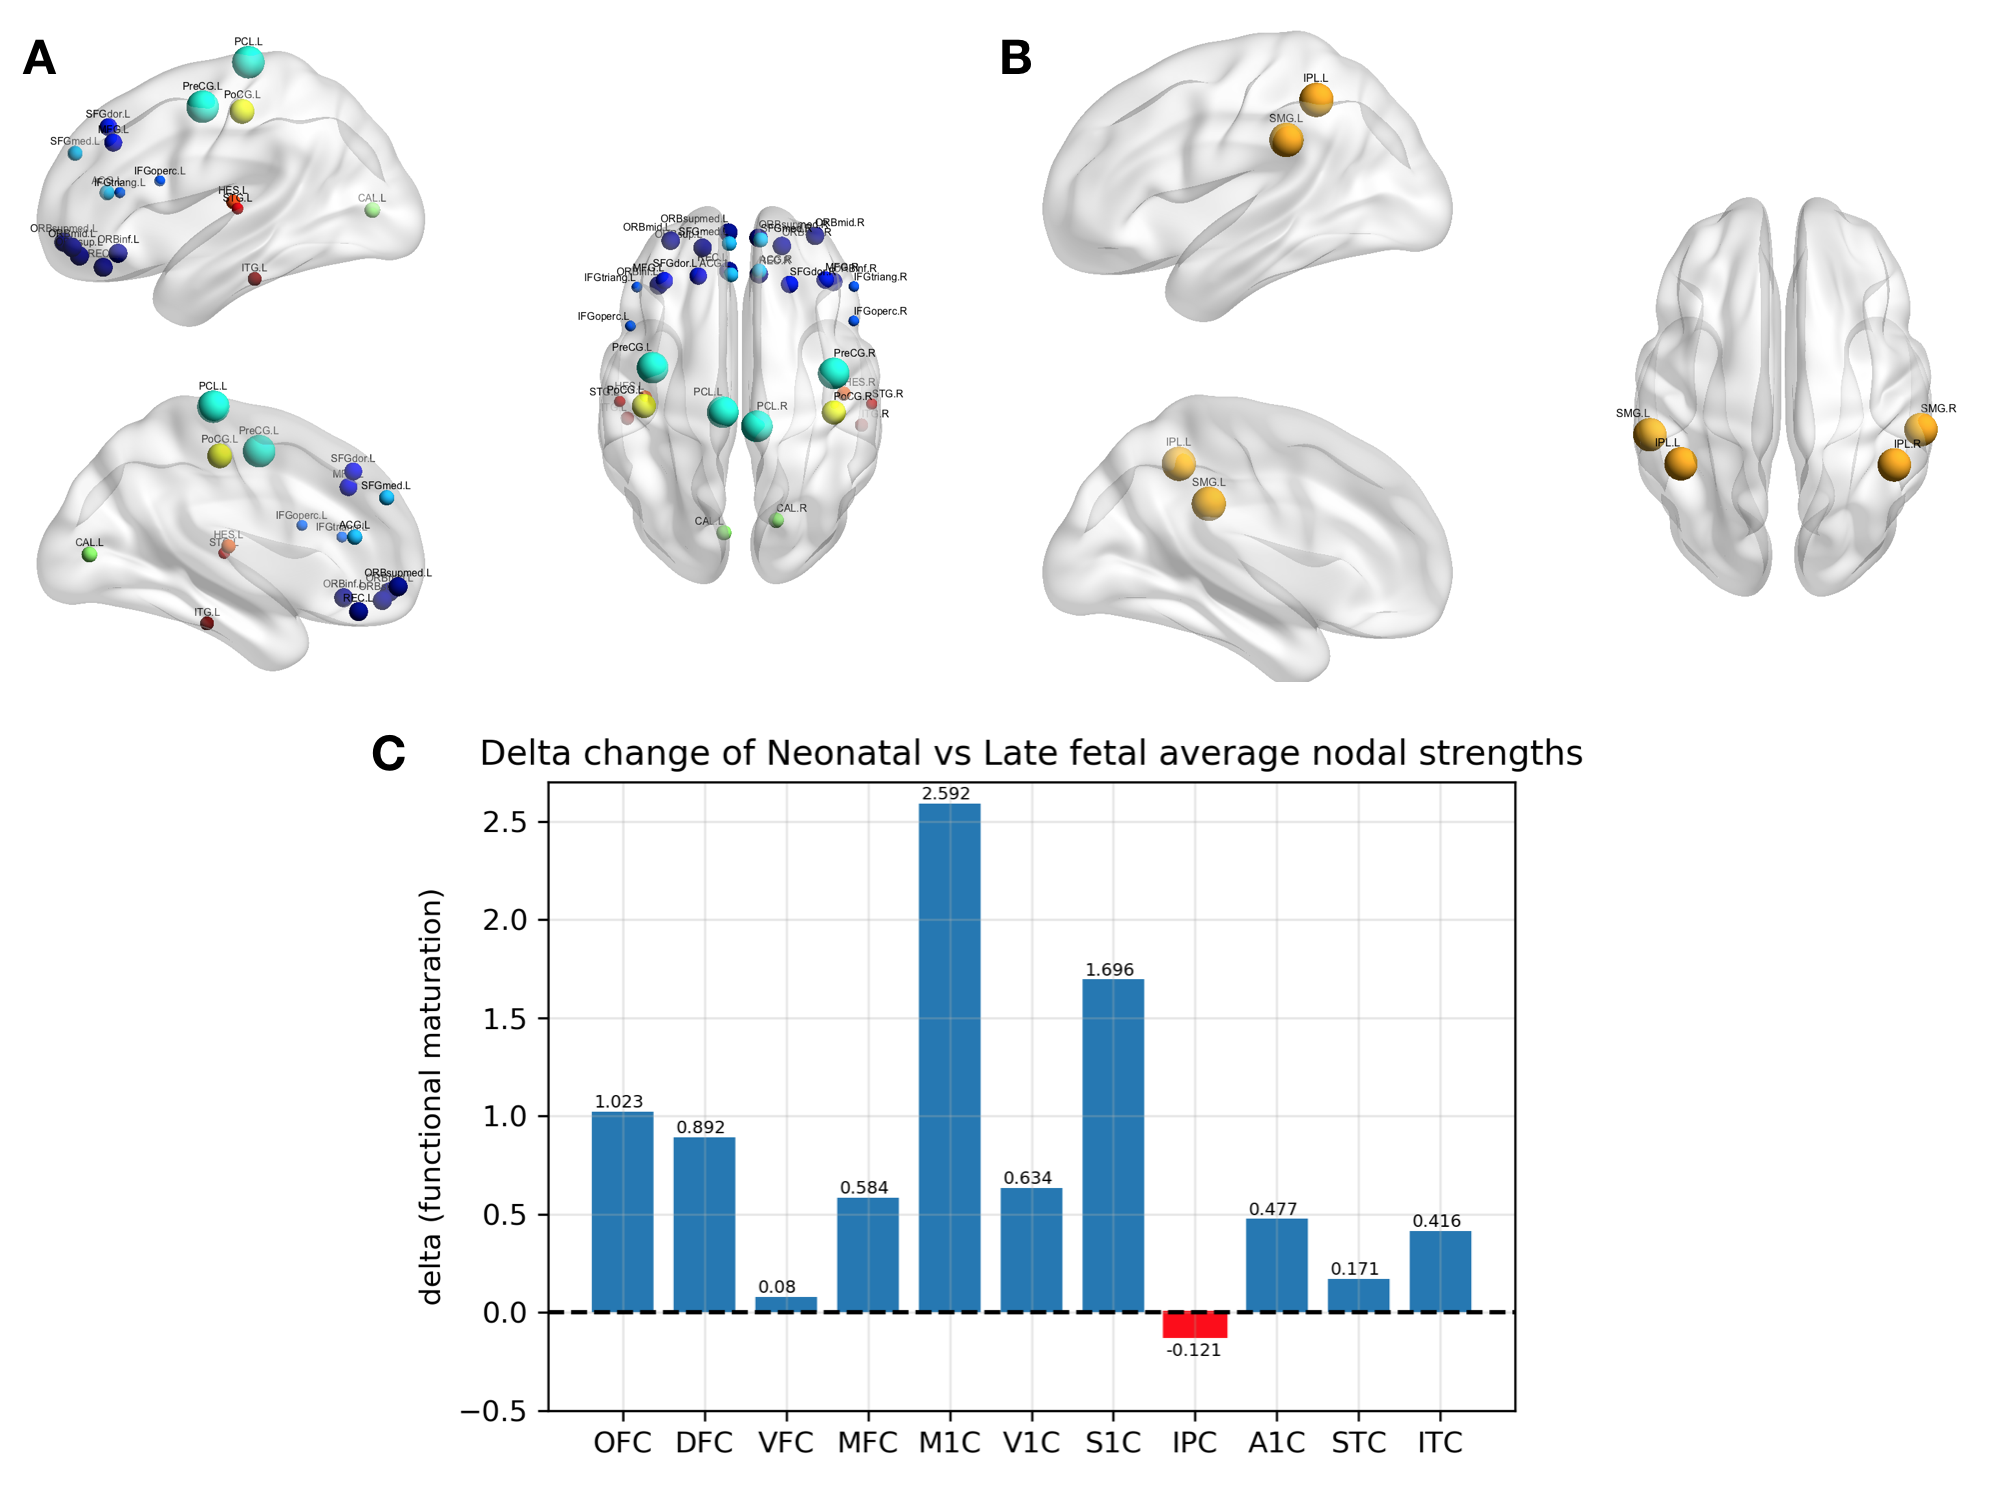
Figure
3: (A) Positive delta (neonatal vs late fetal) changes.
Nodal size corresponds to the delta values: bigger nodes corresponds to higher functional maturation values. (B) Negative
delta changes: bigger nodes correspond to lower functional maturation values. (C) Bar plot showing both positive and
negative delta values for the 11 regions. The brain plots were created by
mapping the delta values of these 11 regions to the corresponding AAL regions.
Nodes with same colour belong to the same region (of these 11).
The abbreviations correspond to
the standard AAL 90 regions atlas.
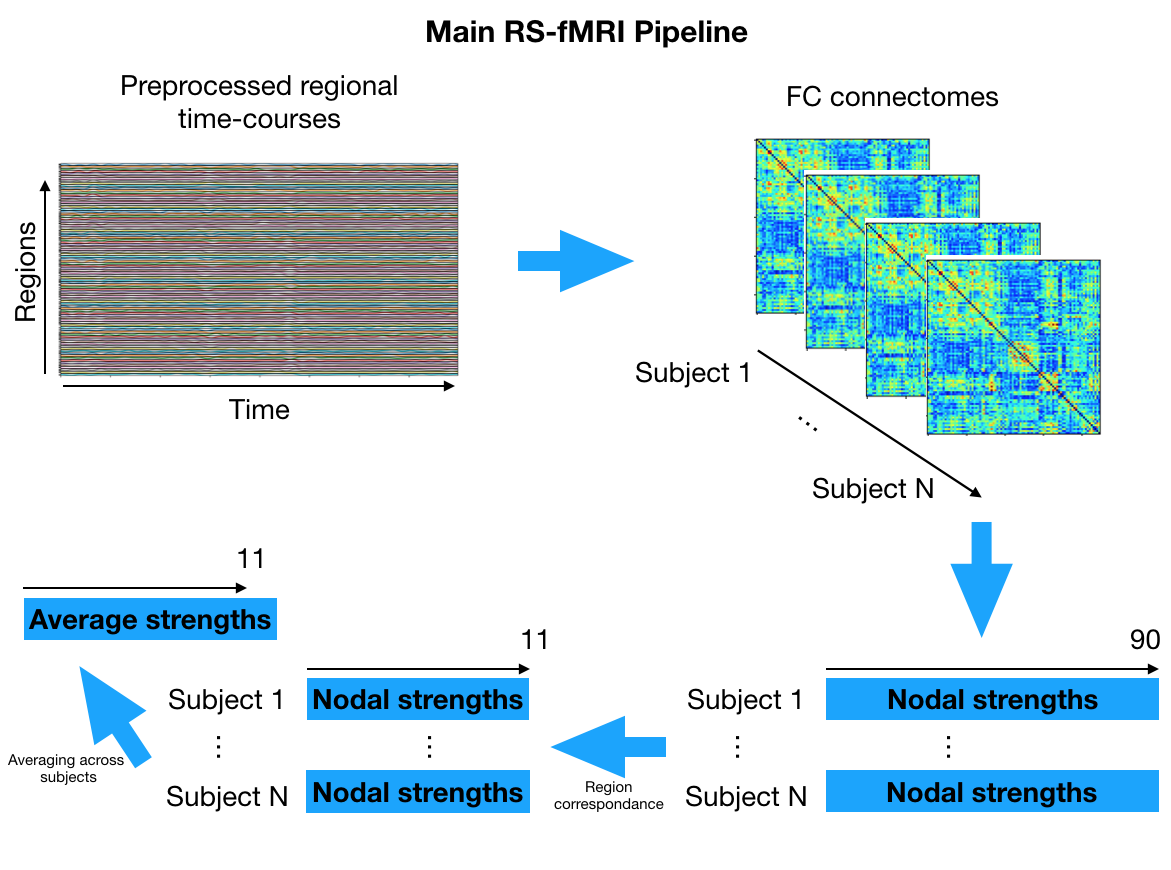
Figure 1: Flow diagram depicting the rs-fMRI
analysis. The analysis was performed for each time-point (33weeks, 40weeks)
independently.