Zahra Shams1, Uzay Emir2, Wybe J.M. van der Kemp1, Dennis W.J. Klomp1, Jannie P. Wijnen1, and Evita Wiegers1
1Radiology, University Medical Center Utrecht, Utrecht, Netherlands, 2School of Health Sciences, College of Health and Human Sciences, Purdue University, West Lafayette, IN, United States
1Radiology, University Medical Center Utrecht, Utrecht, Netherlands, 2School of Health Sciences, College of Health and Human Sciences, Purdue University, West Lafayette, IN, United States
We compared a semi-LASER with TE of 110ms with
editing of 2-HG at 4.02 ppm using MEGA-sLASER with TE of 74ms in phantoms with
different concentrations of 2-HG.
Both methods were able to detect 2-HG concentrations as low as 0.5mM with comparable fitting accuracy.
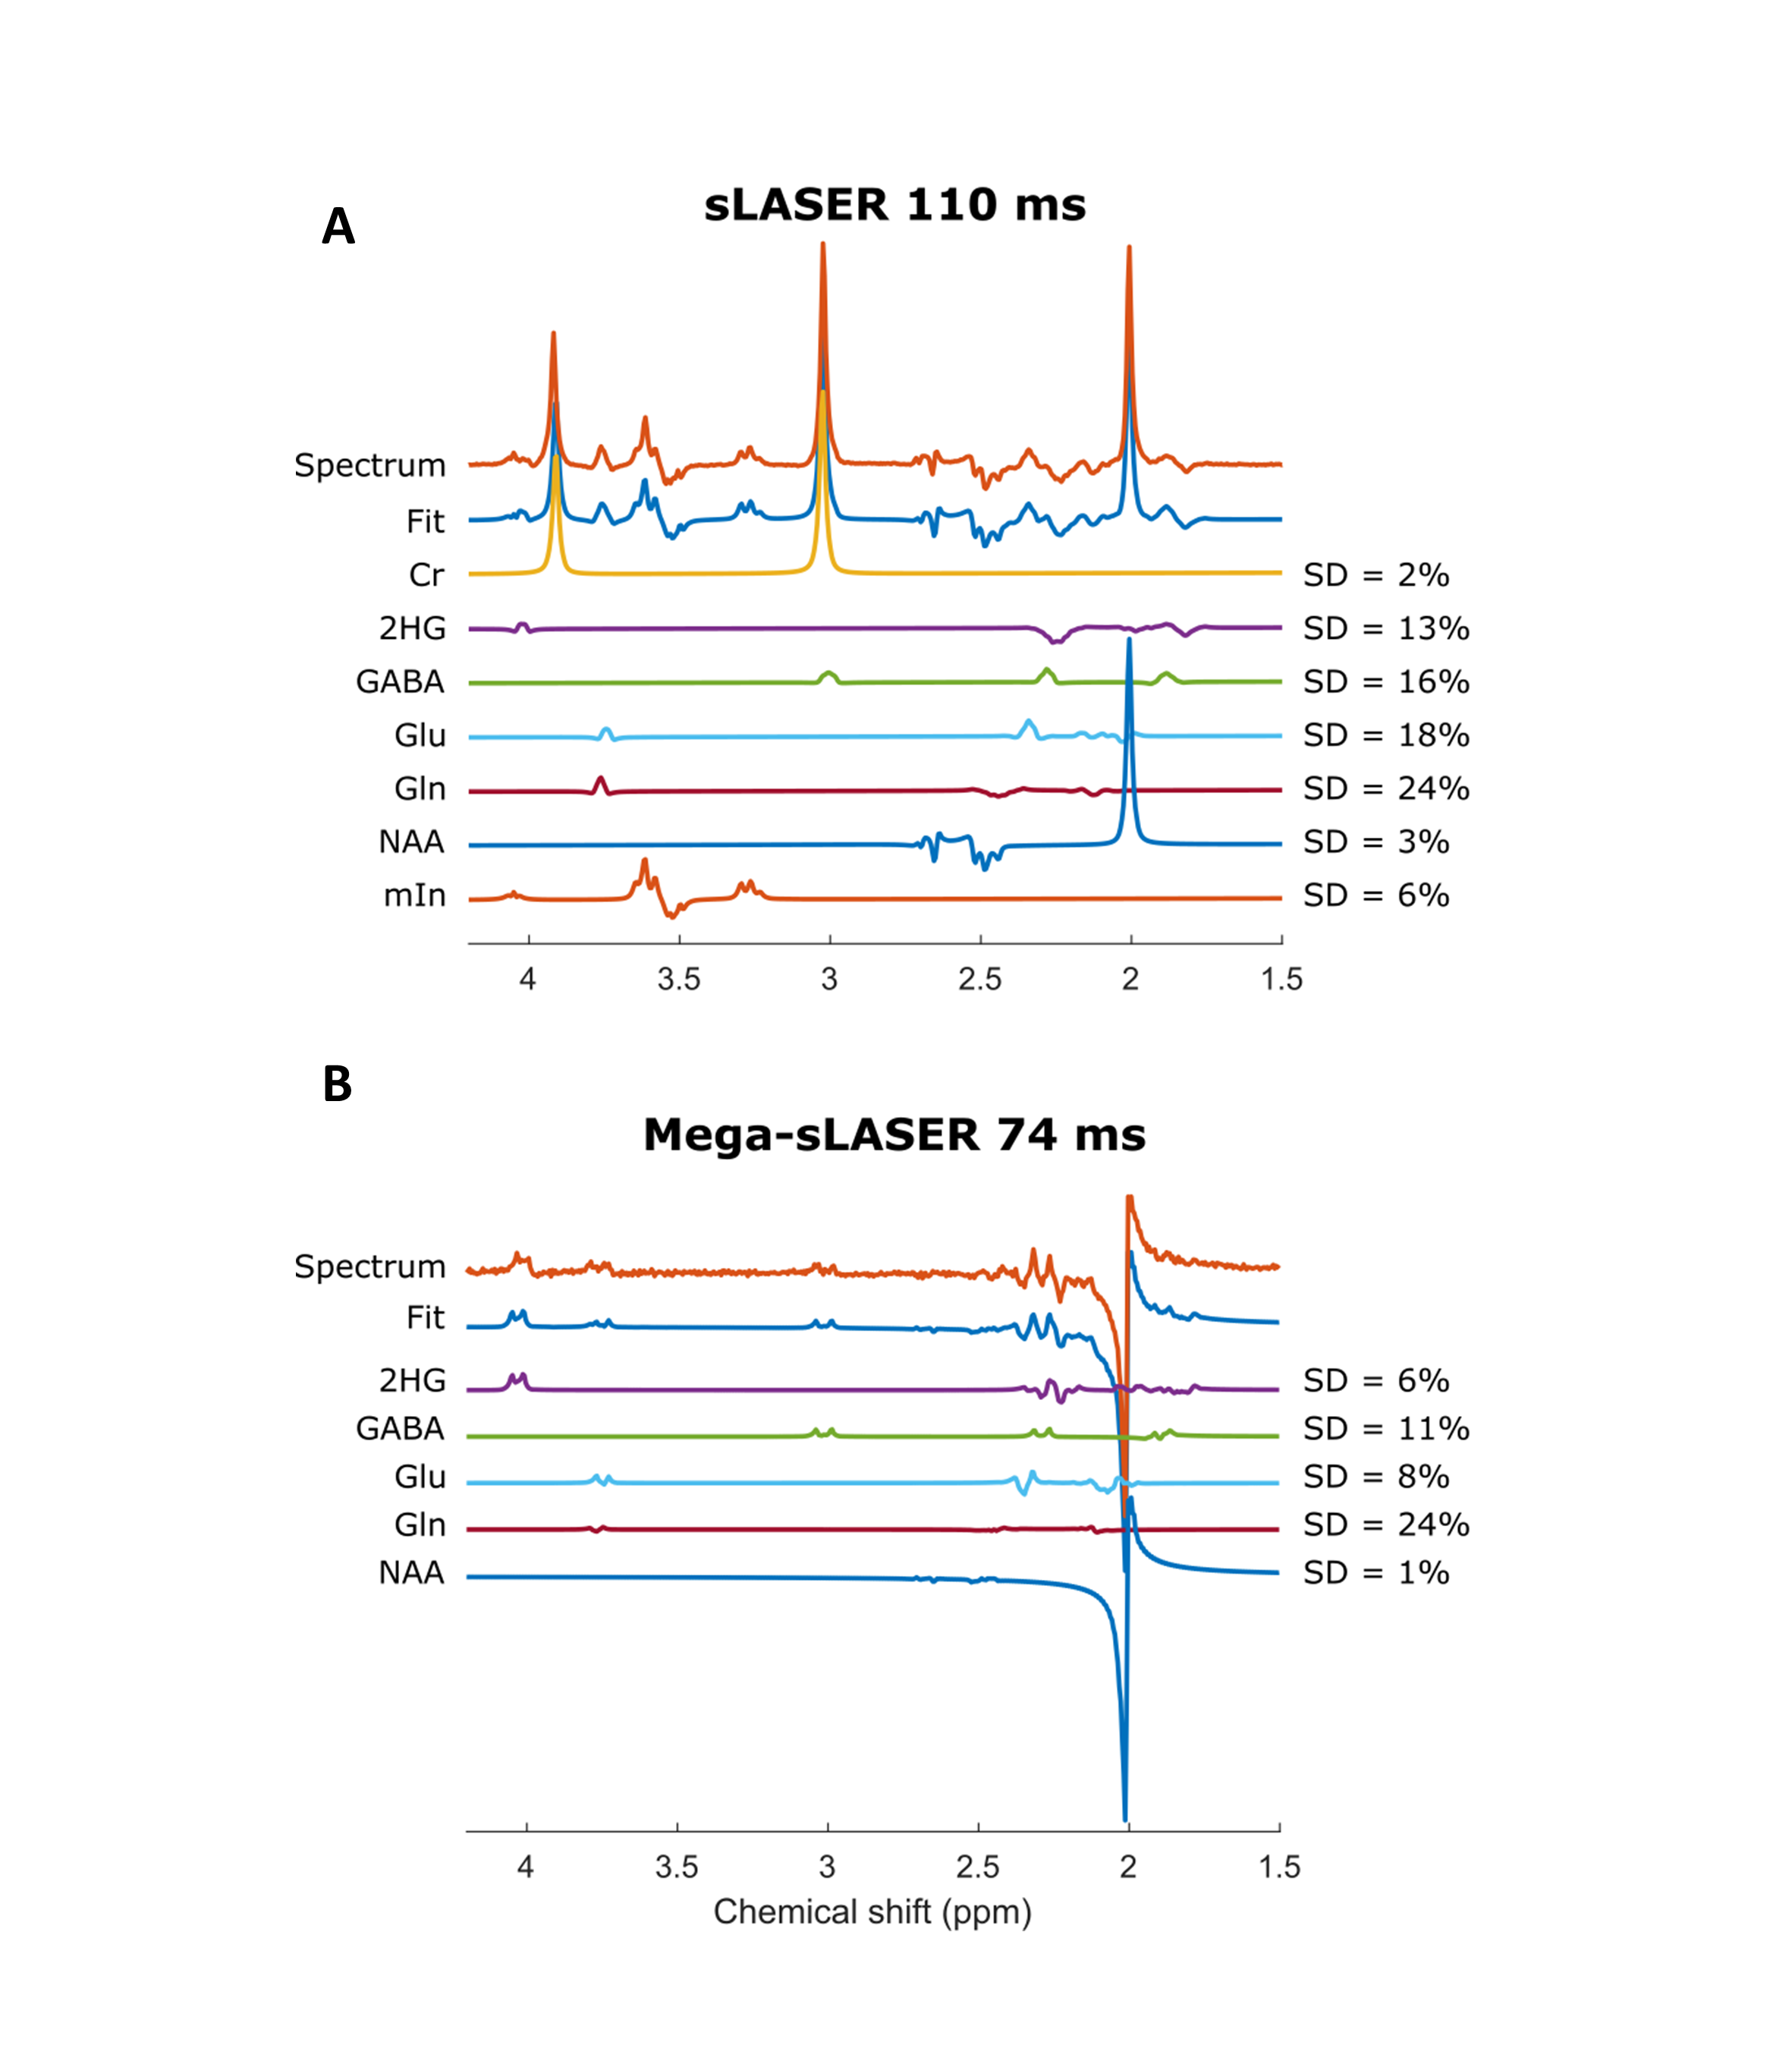
Figure 3. Spectra and the fits from a phantom containing 2-HG, Cr,
NAA, Glu, Gln, GABA and mIn acquired from semi-LASER TE110ms (A) and
MEGA-sLASER TE74ms (B). The relative concentrations (/NAA) can be found in
Table1.1 and Table1.2.
Cr,
creatine; NAA, N-acetylaspartate; Glu, glutamate; Gln, glutamine; GABA,
γ-aminobutyric acid; mIn, myo-inositol.
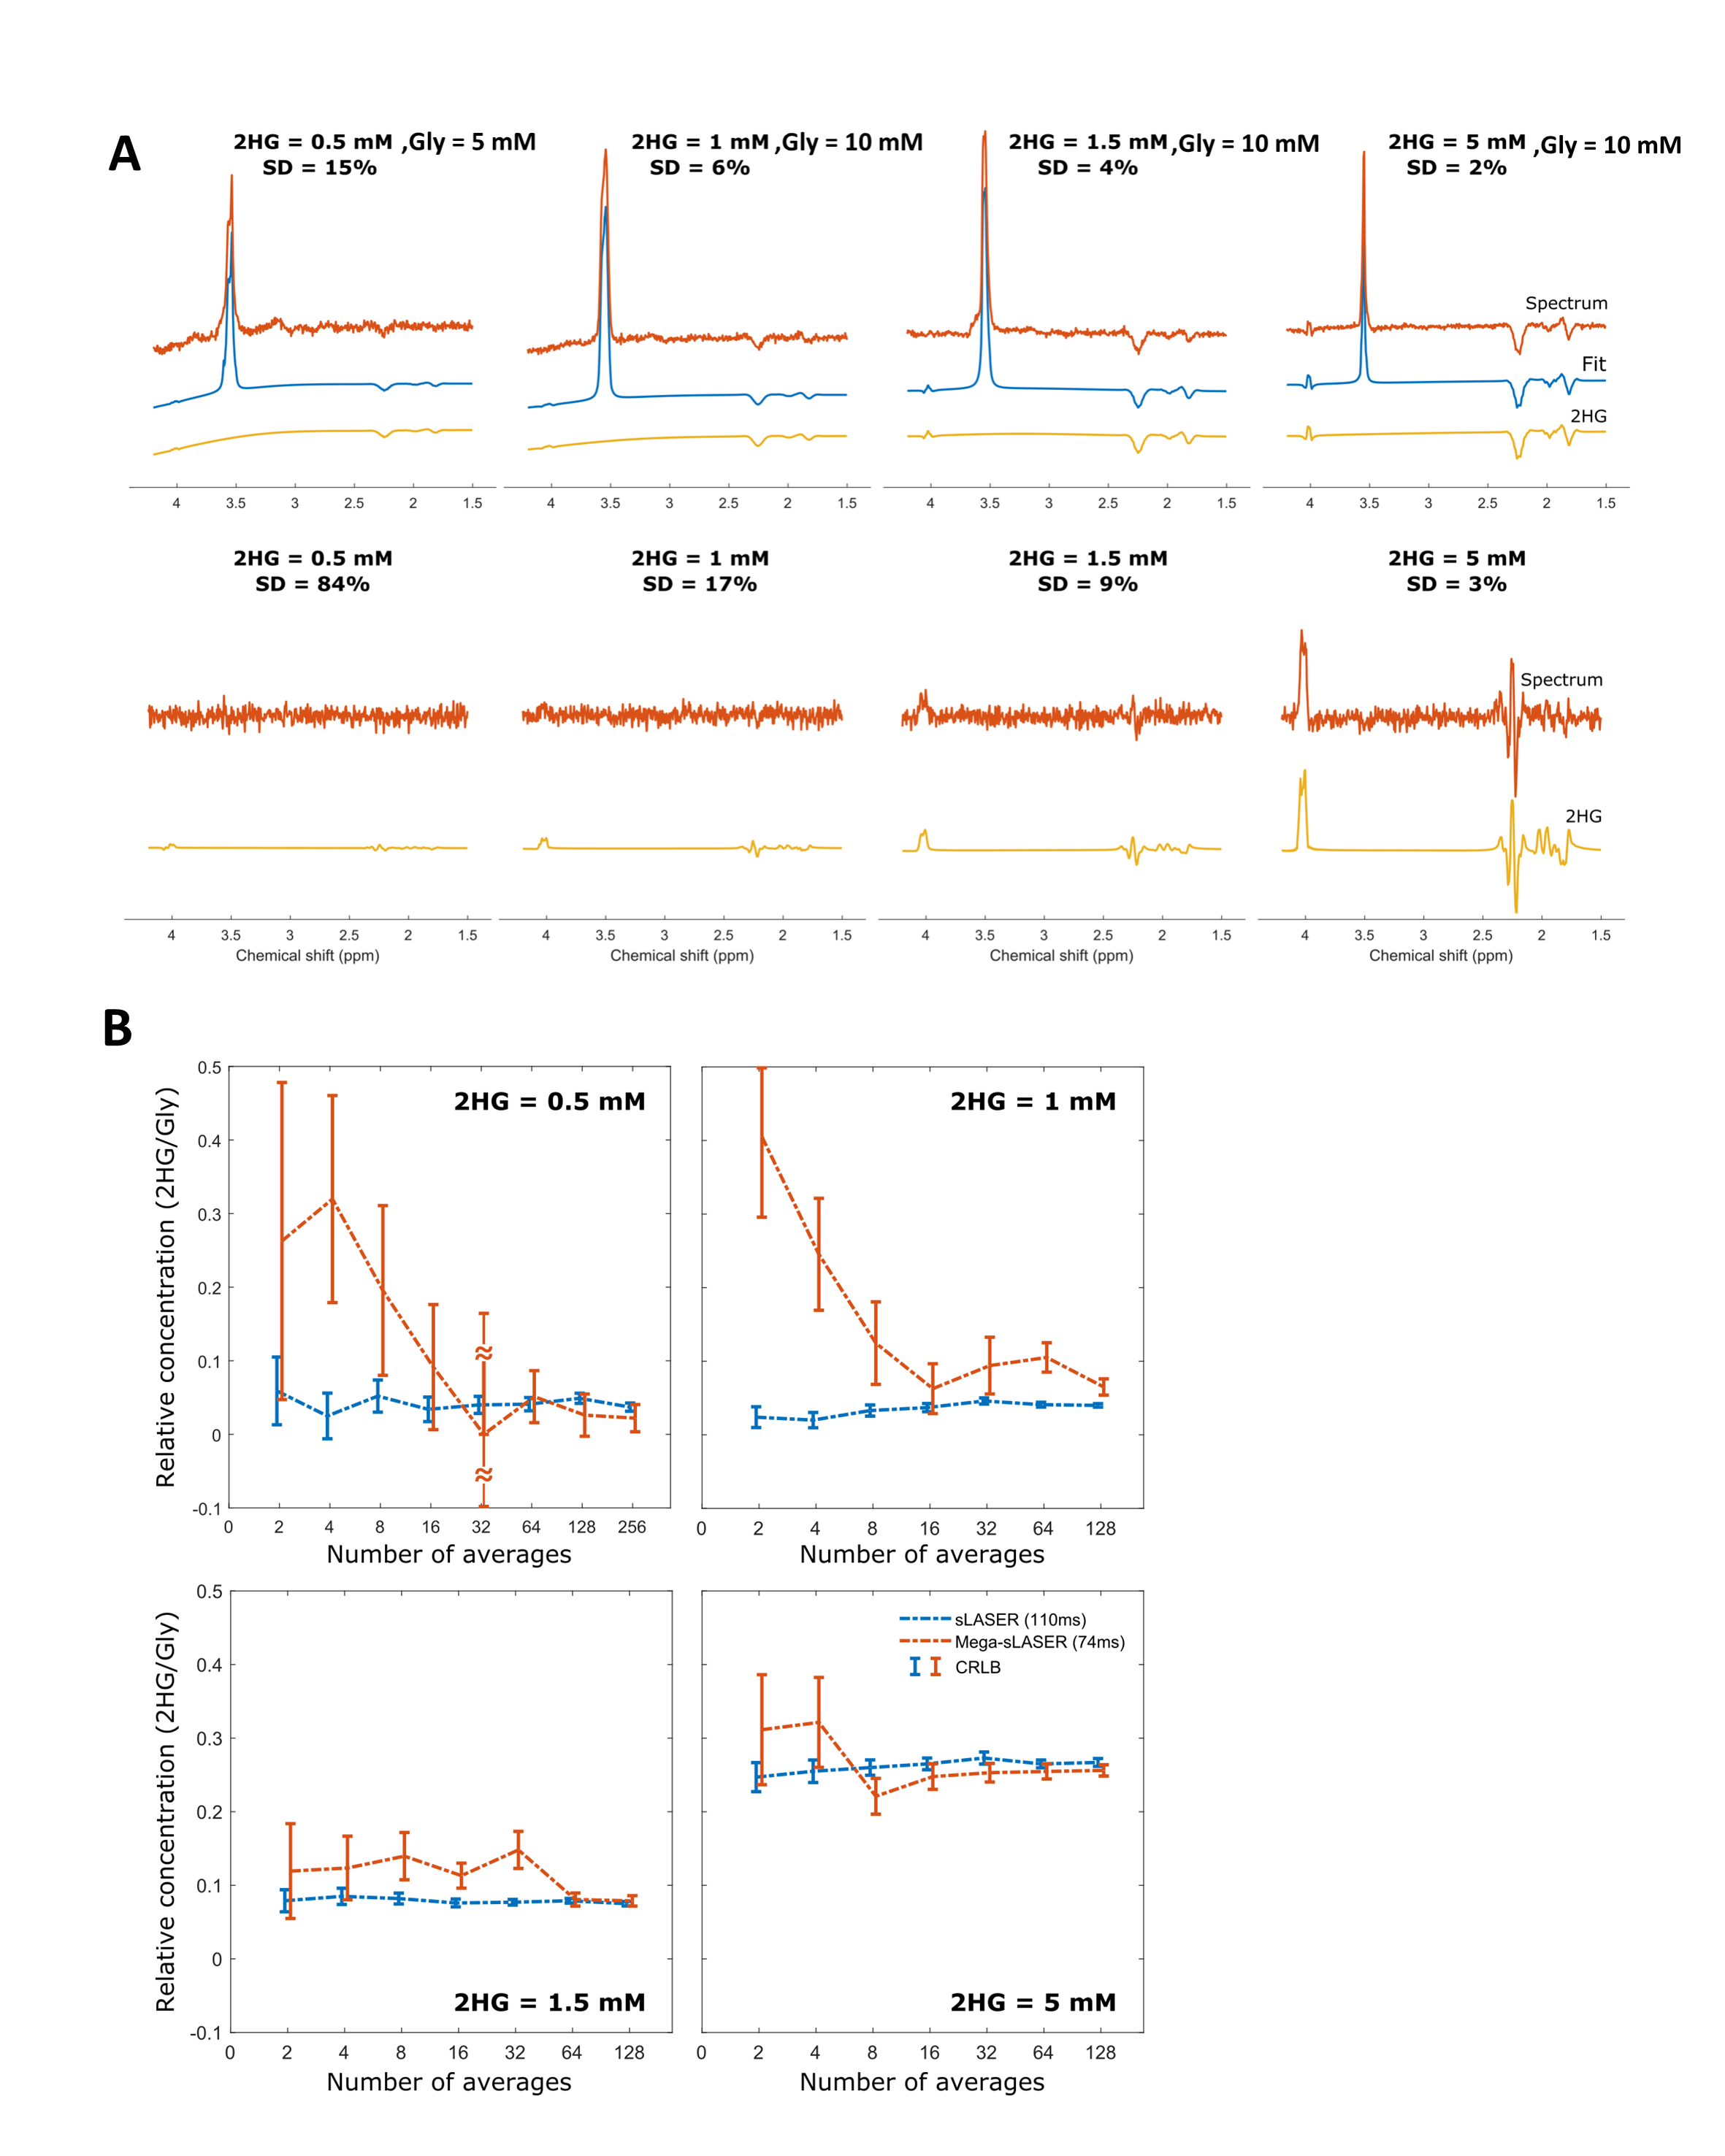
Figure 2. (A) Spectra and the fits of the four phantoms
containing 2-HG (0.5, 1, 1.5 and 5 mM) and Glycine (10, 10, 10, 5 mM) from semi-LASER
TE110ms (top) and MEGA-sLASER TE74ms (bottom) experiments. (B) Relative
concentration of 2-HG to Glycine in those phantoms as a function of number of
averages. To calculate the relative 2-HG and Gly concentration for Mega-sLASER
measurements, the concentration of Gly was derived from the off spectra by
LCModel. The errorbars are the CRLB(%)/100 multiplied by the relative
concentration at that average. The sign “≈” means the CRLB (%) of 999.