1Neuroscience Research Center, Taipei Medical University, Taipei, Taiwan, 2Translational Imaging Research Center, Taipei Medical University Hospital, Taipei, Taiwan, 3Department of Medical Imaging, Taipei Medical University Hospital, Taipei, Taiwan, 4Graduate Institute of Biomedical Electrics and Bioinformatics, Taipei, Taiwan, 5Department of Radiology, School of Medicine, College of Medicine, Taipei Medical University, Taipei, Taiwan, 6Research Center for Artificial Intelligence in Medicine, Taipei Medical University, Taipei, Taiwan
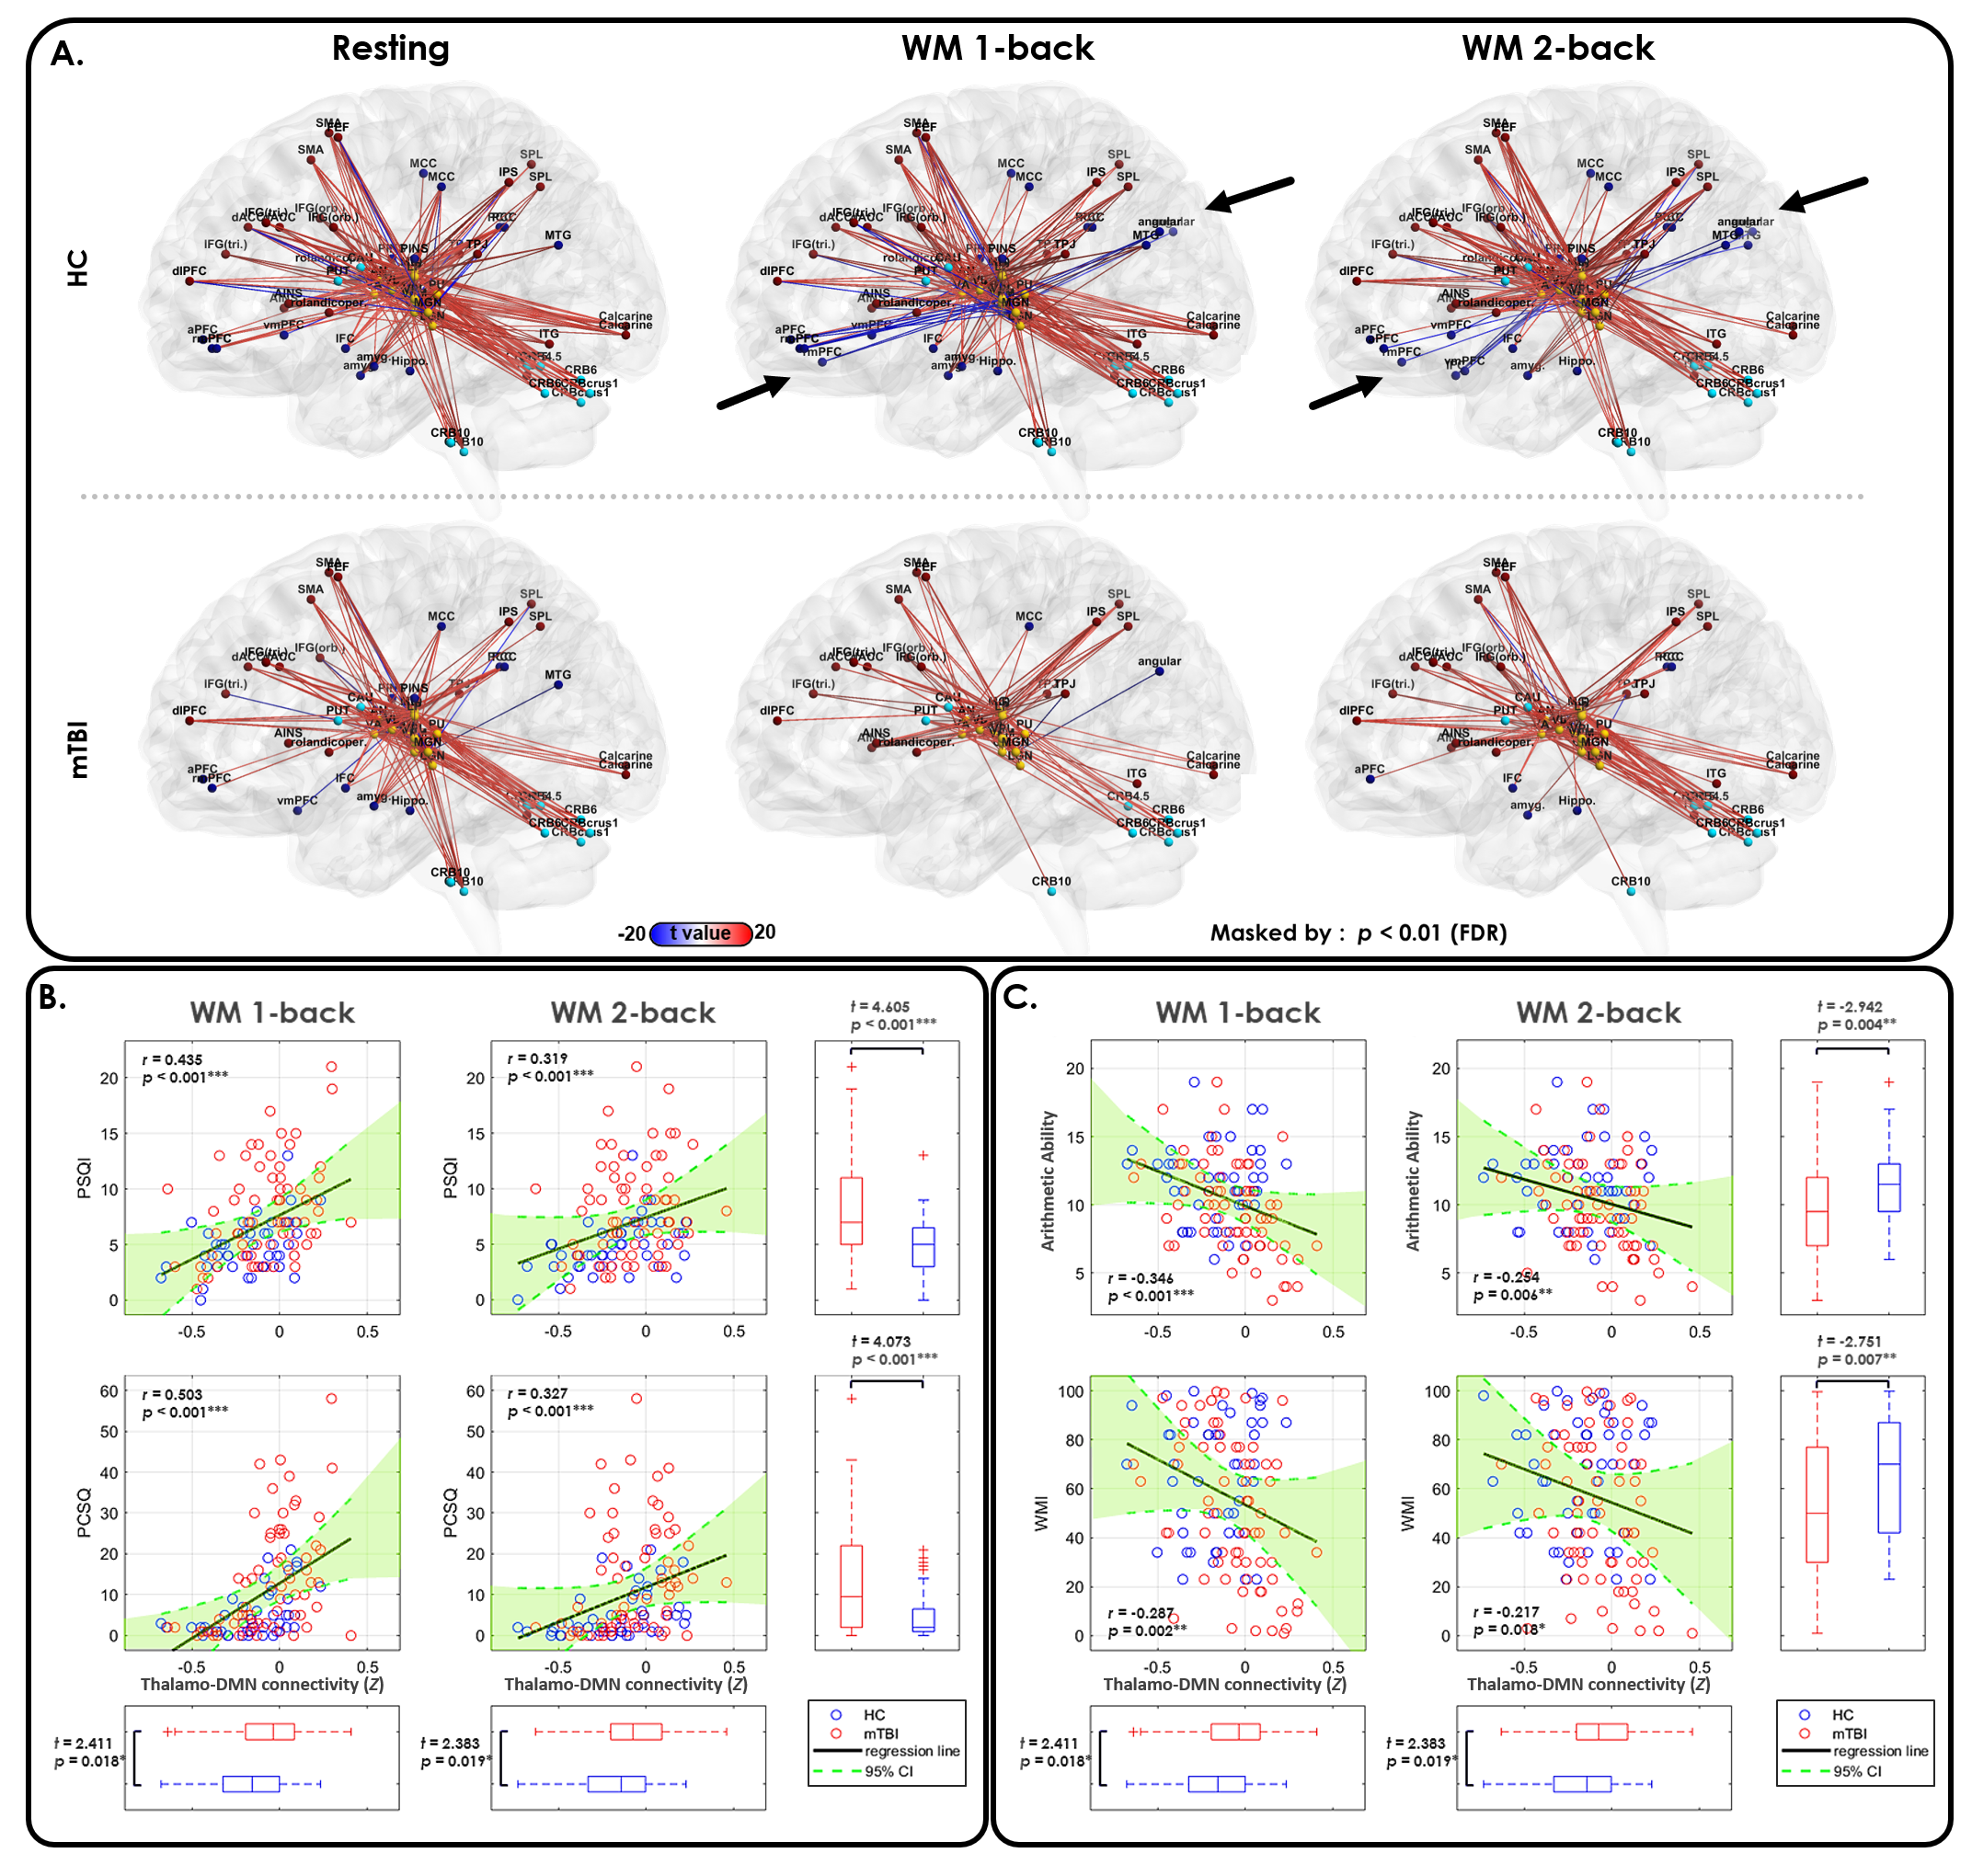
Figure 2. Thalamocortical functional connectivity changes and their clinical significance in mTBI.
(A) Patients with mTBI exhibited significantly reduced thalamo-DMN anticorrelation (black arrows) during WM 1-back and 2-back task conditions compared with the HCs.
Thalamo-DMN anticorrelation strength exhibited (B) a significant positive correlation with participants’ PSQI and PCSQ scores and (C) a significant negative correlation with participants’ arithmetic ability and WMI during the WM 1-back and 2-back task conditions.
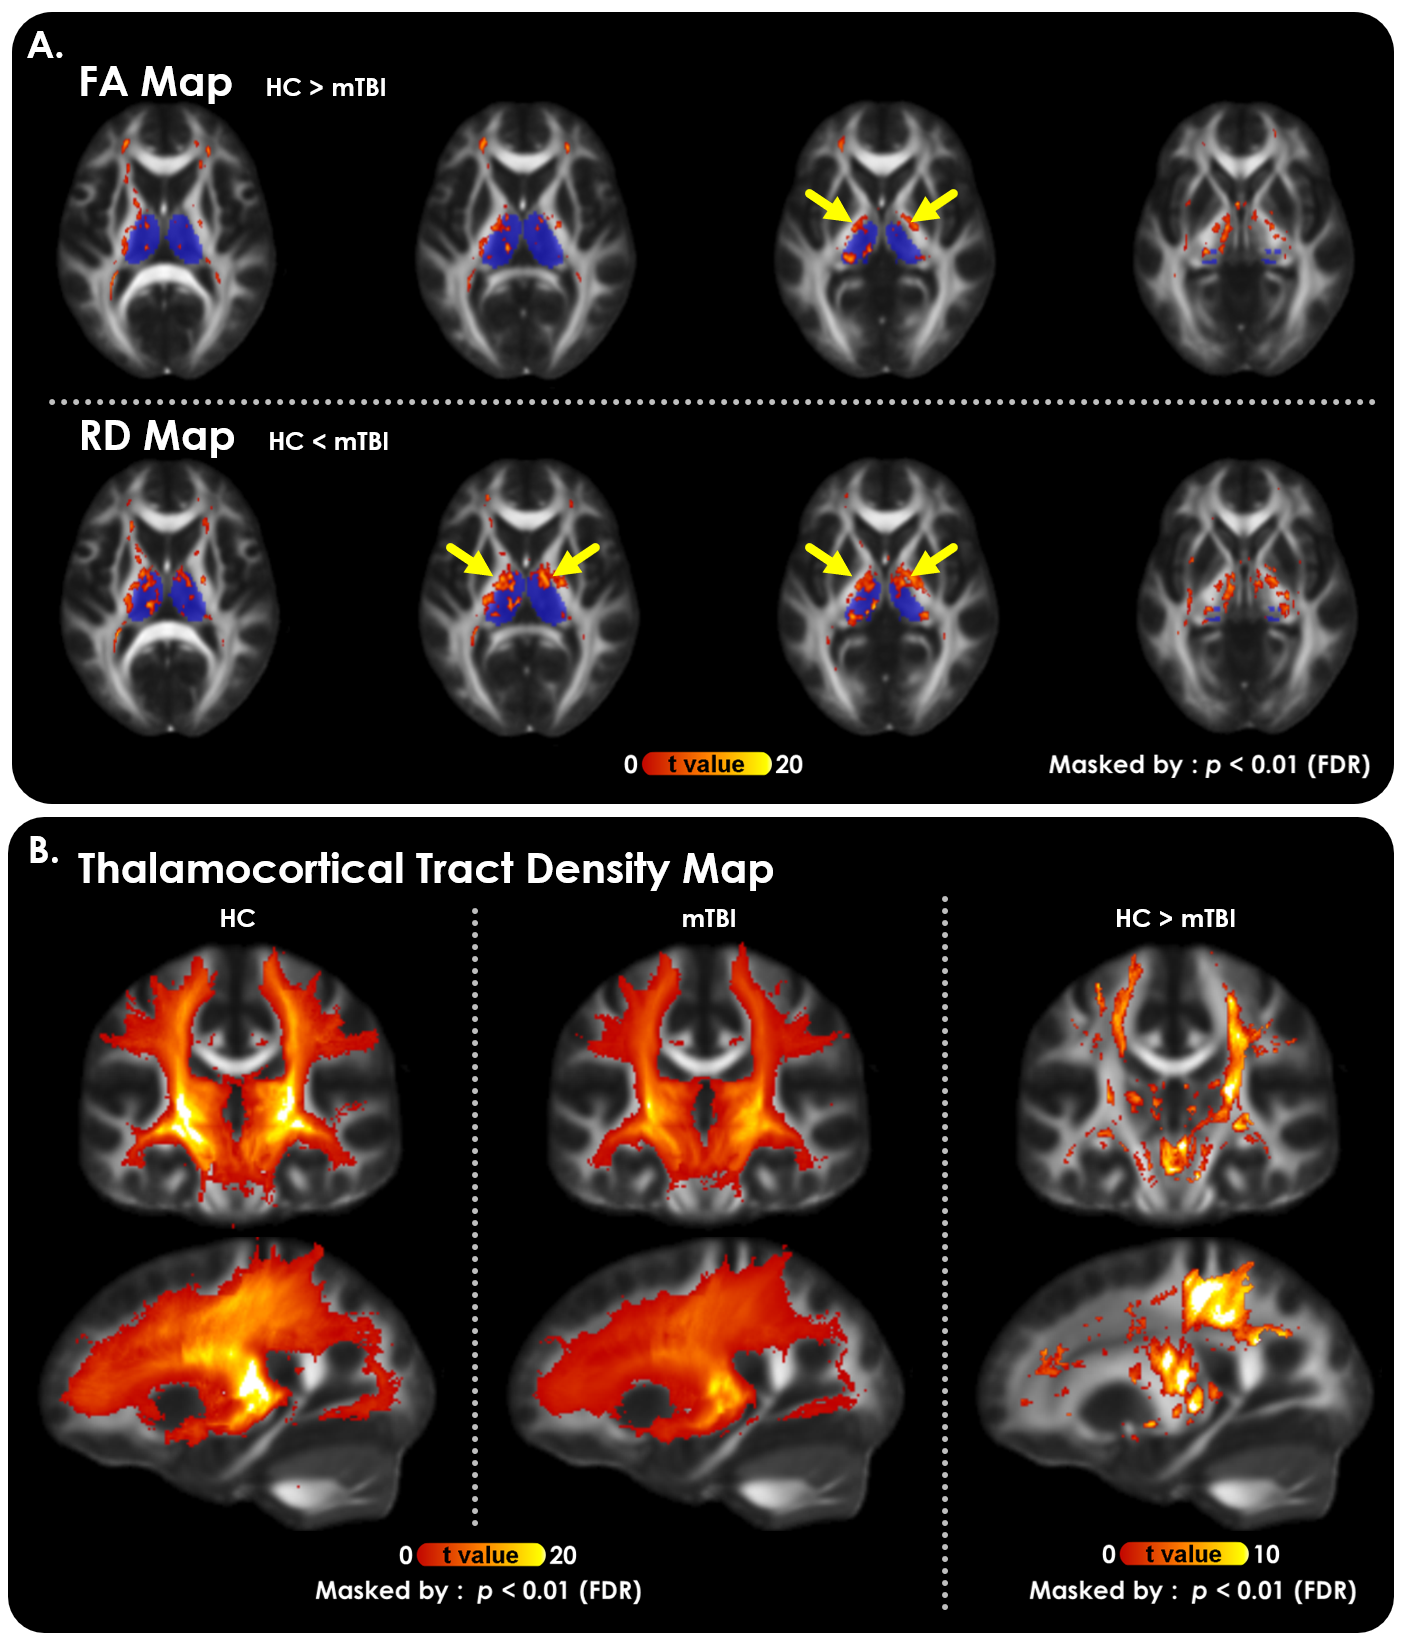
Figure 1. Structural evidence of two TCD origins in mTBI revealed by DTI.
(A) Significantly decreased FA (top row) and increased RD (bottom) at the bilateral thalamic borders (yellow arrows) were observed in patients with mTBI compared with HCs (p<0.01, FDR corrected). The ovals covered by translucent dark blue indicate the location of the bilateral thalamus. These maps were masked by the threshold of group-averaged FA > 0.2.
(B) A significant reduction in thalamocortical tract density was found in the mTBI group compared with the HC group (p<0.01, FDR corrected).