TERESA GERHALTER1, Martijn Cloos2, Seena Dehkharghani1, Anna M. Chen1, Rosermary Peralta1, Fatemeh Adlparvar1, James S. Babb1, Tamara Bushnik3, Jonathan M. Silver4, Brian S. Im3, Stephen P. Wall5, Guillaume Madelin1, and Ivan Kirov1
1Center for Biomedical Imaging, Department of Radiology, New York University Grossman School of Medicine, NEW YORK, NY, United States, 2Centre for Advanced Imaging, The University of Queensland, Brisbane, Australia, 3Department of Rehabilitation Medicine, New York University Grossman School of Medicine, NEW YORK, NY, United States, 4Department of Psychiatry, New York University Grossman School of Medicine, NEW YORK, NY, United States, 5Ronald O. Perelman Department of Emergency Medicine, New York University Grossman School of Medicine, NEW YORK, NY, United States
1Center for Biomedical Imaging, Department of Radiology, New York University Grossman School of Medicine, NEW YORK, NY, United States, 2Centre for Advanced Imaging, The University of Queensland, Brisbane, Australia, 3Department of Rehabilitation Medicine, New York University Grossman School of Medicine, NEW YORK, NY, United States, 4Department of Psychiatry, New York University Grossman School of Medicine, NEW YORK, NY, United States, 5Ronald O. Perelman Department of Emergency Medicine, New York University Grossman School of Medicine, NEW YORK, NY, United States
MR
fingerprinting revealed that T1 obtained on average 1 month after mild
traumatic brain injury
was
associated with clinical presentation and cognitive performance at a 3-month
follow-up.
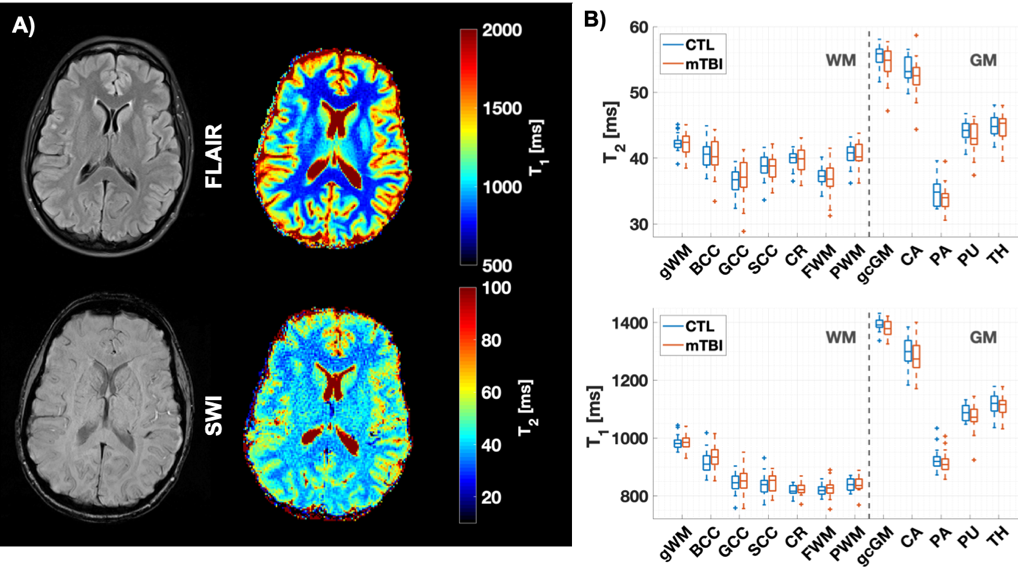
Figure 2: A) Examples of qualitative and quantitative images. Example T1 and T2
maps, alongside co-registered SWI and FLAIR images are shown from a
34-year-old female mTBI patient at one month after brain injury. Note the stark
T1 and T2 difference between grey and white matter. B) Boxplots of T1 and T2 distributions in mTBI patients and controls. Note that T1 and T2 from mTBI did not differ from controls for any
regions. See Fig 1 for abbreviations of regions.
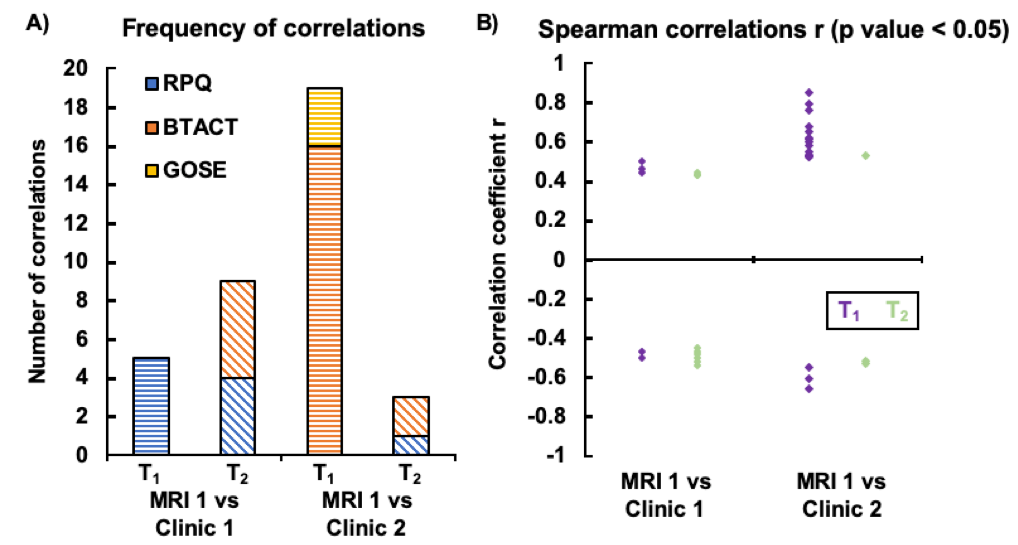
Figure 3: Correlations
between T1 and T2 with patient assessments.
A)
T1 and T2 correlation frequencies
measured in outlined regions with the neurological assessments (RPQ, BTACT,
GOSE) are plotted for those correlations with p<0.05. Note the higher
frequency of T1 correlations with clinical outcome at time 2 compared to time
point 1. B) The same associations (p<0.05) are plotted against the correlation
coefficient, but without separating the outcome measures. T1 showed more
positive associations with clinical outcome at time 2, which were also
generally stronger than those for T2.