Andreea Hertanu1,2, Lucas Soustelle1,2, Arnaud Le Troter1,2, Julie Buron1,2,3, Julie Le Priellec3, Myriam Cayre3, Pascale Durbec3, Gopal Varma4, David C. Alsop4, Olivier M. Girard1,2, and Guillaume Duhamel1,2
1Aix Marseille Univ, CNRS, CRMBM, Marseille, France, 2APHM, Hôpital Universitaire Timone, CEMEREM, Marseille, France, 3Aix Marseille Univ, CNRS, IBDM, Marseille, France, 4Division of MR Research, Radiology, Beth Israel Deaconess Medical Center, Harvard Medical School, Boston, MA, United States
1Aix Marseille Univ, CNRS, CRMBM, Marseille, France, 2APHM, Hôpital Universitaire Timone, CEMEREM, Marseille, France, 3Aix Marseille Univ, CNRS, IBDM, Marseille, France, 4Division of MR Research, Radiology, Beth Israel Deaconess Medical Center, Harvard Medical School, Boston, MA, United States
IhMT
filtered from short-T1D components and corrected for T1/B1
effects (ihMTsat) offers the highest specificity to healthy myelinated tissues
in the mouse brain when compared to other metrics such as MPF, T1
and ihMTR.
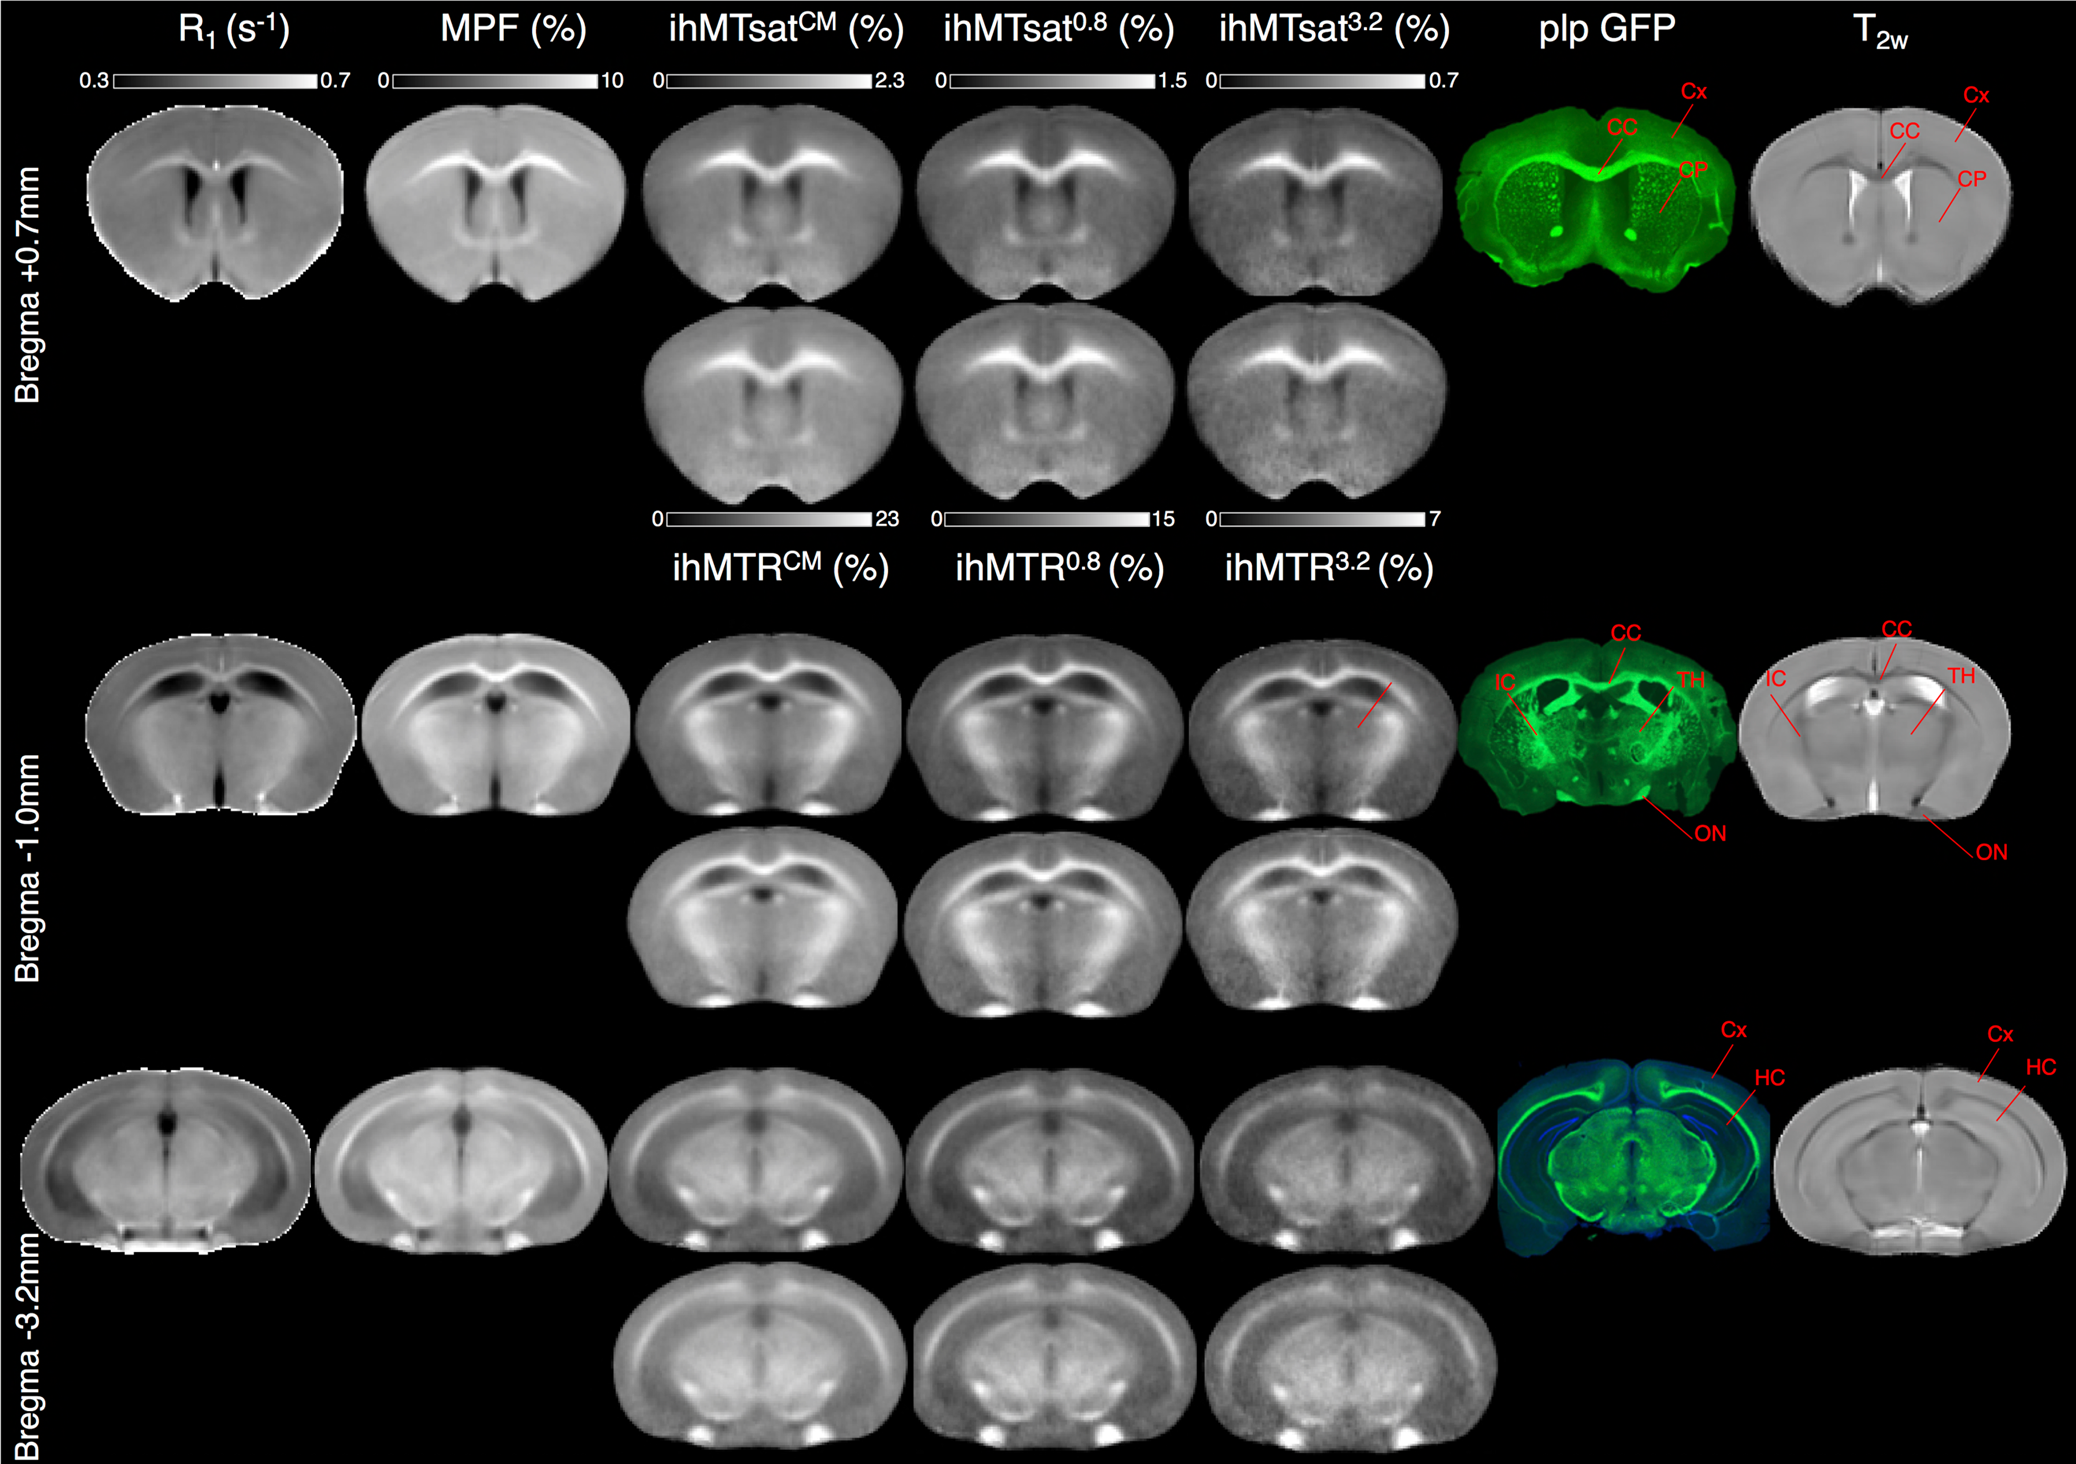
Figure
2: Representative slices of the 3D templates for R1, MPF, ihMTR,
ihMTsat with different T1D-filtering along with plp-GFP fluorescence
microscopy images at -3.2, -0.7 and +0.7 mm from bregma. Brain structures in WM
(IC – internal capsule, CC – medial corpus callosum, ON
– optical tract), Grey Matter (CTX – cerebral cortex, HP – hippocampus) and
mixed WM/GM structures (TH – thalamus, CP – caudoputamen)
where quantitative analyses were performed are indicated on the T2w/plp-GFP
images.

Figure 3: Correlations of MR metrics
and plp-GFP signal. a) Pearson
correlation coefficient matrix for all techniques. b) Linear regressions of normalized R1, MPF, ihMTR0.8
and ihMTsat0.8 with GFP. c)
Linear regression of MPF with ihMTsatCM, ihMTsat0.8,
ihMTsat1.6 and ihMTsat3.2. Shaded areas correspond to confidence curves for line
fits with an α-level of 0.1.
