Roy AM Haast1, Sriranga Kashyap2, Mohamed D Yousif1, Dimo Ivanov2, Benedikt A Poser2, and Ali R Khan1
1Centre for Functional and Metabolic Mapping, Western University, London, ON, Canada, 2Maastricht University, Maastricht, Netherlands
1Centre for Functional and Metabolic Mapping, Western University, London, ON, Canada, 2Maastricht University, Maastricht, Netherlands
In this study we used arterial spin labeling combined with time-of-flight angiography acquired at 7T to delineate perfusion and the effects of vascularisation patterns across the hippocampal subfields.
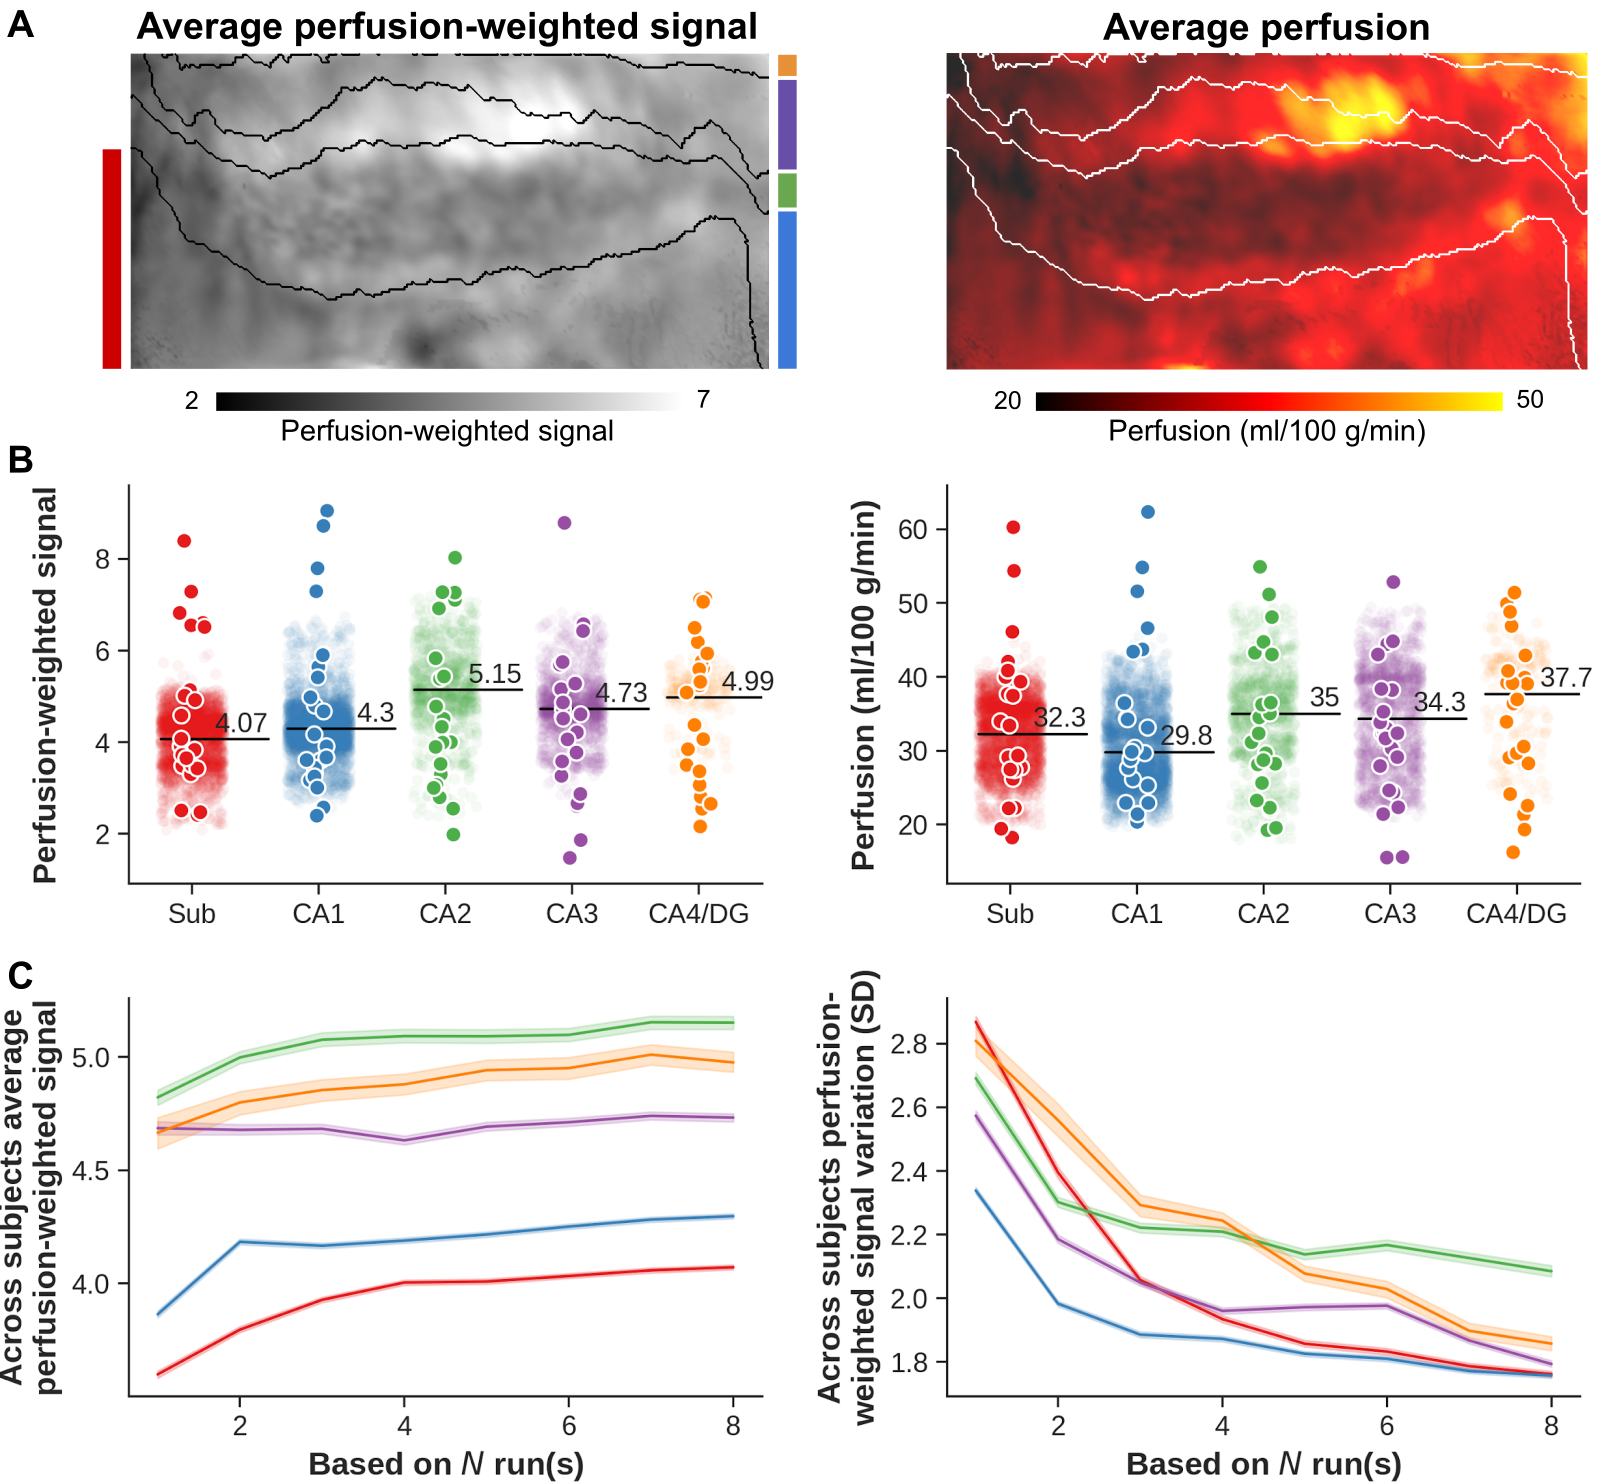
Across subjects average (A) perfusion-weighted (left) and perfusion (right) flatmaps. Subfield-specific averages, per subject and hemisphere, are shown in B for both perfusion-weighted (left) and perfusion metrics (right). Semi-transparent points show vertex-wise averages. Across subjects average perfusion-weighted signal (left) and standard variation (right), as a function of number of included runs and separated per subfield (colored lines) are displayed in C.

Correlation analyses between vertex-wise perfusion-weighted average across-subjects (A, y-axis), standard variation (B, y-axis) and distance (x-axes). Marginal plots show distribution for the metric displayed along that axis. Points are color-coded based on the diameter of most nearby vessel. Overlaid solid and dashed lines indicate corresponding best fits for each category of diameter.
