Ying Xiong1, Qiang Zhang2, and Wenzhen Zhu1
1Radiology, Tongji Hospital Tongji Medical College Huazhong University of Science and Technology, Wuhan, China, 2Neurology, Tongji Hospital Tongji Medical College Huazhong University of Science and Technology, Wuhan, China
1Radiology, Tongji Hospital Tongji Medical College Huazhong University of Science and Technology, Wuhan, China, 2Neurology, Tongji Hospital Tongji Medical College Huazhong University of Science and Technology, Wuhan, China
This study aims to
investigate the topological organization alterations of structural and
functional connectomes in T2DM patients with and without impairment. Forty-four
T2DM patients were divided into two sub-groups (impaired and normal cognition),
together with 25 controls, were imaged at a 3T scanner. Axial DTI images and
functional MR images were obtained using a single-shot diffusion-weighted echo
planar imaging sequence and a gradient-echo echo planar imaging sequence. Both
structural and functional networks were constructed, and graph-theory based
network measurements were analyzed. For the structural connectome (SC), the
DM-MCI group exhibited significant decreased Eg (p=0.025) and Eloc (p=0.041) as
well as increased Lp (p=0.003) values, compared to the controls and DM-NC
group. For the functional connectome (FC), however, the DM-MCI group exhibited
significant increased Eloc (p=0.046) and Cp (p=0.033) values. No significant
difference of Eg, Eloc, Cp, or Lp for both SC and FC networks was found between
the DM-NC group and the
controls. Significant
group differences in reduced nodal efficiency were found in 14 regions for the
SC network while decreased nodal efficiency were found in 10 regions for the FC
network. Meanwhile, increased nodal efficiency were found in 6 regions of the
DM-MCI group compared to the controls and DM-NC group, which may reflect a
compensation in those areas after long-term weakened neural activities. Some network metrics
were correlated with neuropsychological assessments, glycated hemoglobin level
and disease duration. The structural and functional connectomes research shows
potential feasibility in characterizing intrinsic alterations of diabetic
encephalopathy.

Fig.3
Significant pattern differences of brain connectivity among three groups. The
node sizes indicate the significance of between-group differences in the nodal
efficiency. (A) For the SC network, nodes in blue showed reduced efficiency in DM-MCI
and DM-NC patients compared to controls, and decreased efficiency in DM-MCI
compared with DM-NC (p<0.05, corrected). (B) For the FC network,
nodes in red showed increased efficiency in DM-MCI compared to DM-NC and controls.
Nodes in blue showed decreased efficiency in DM-MCI and DM-NC compared to controls.
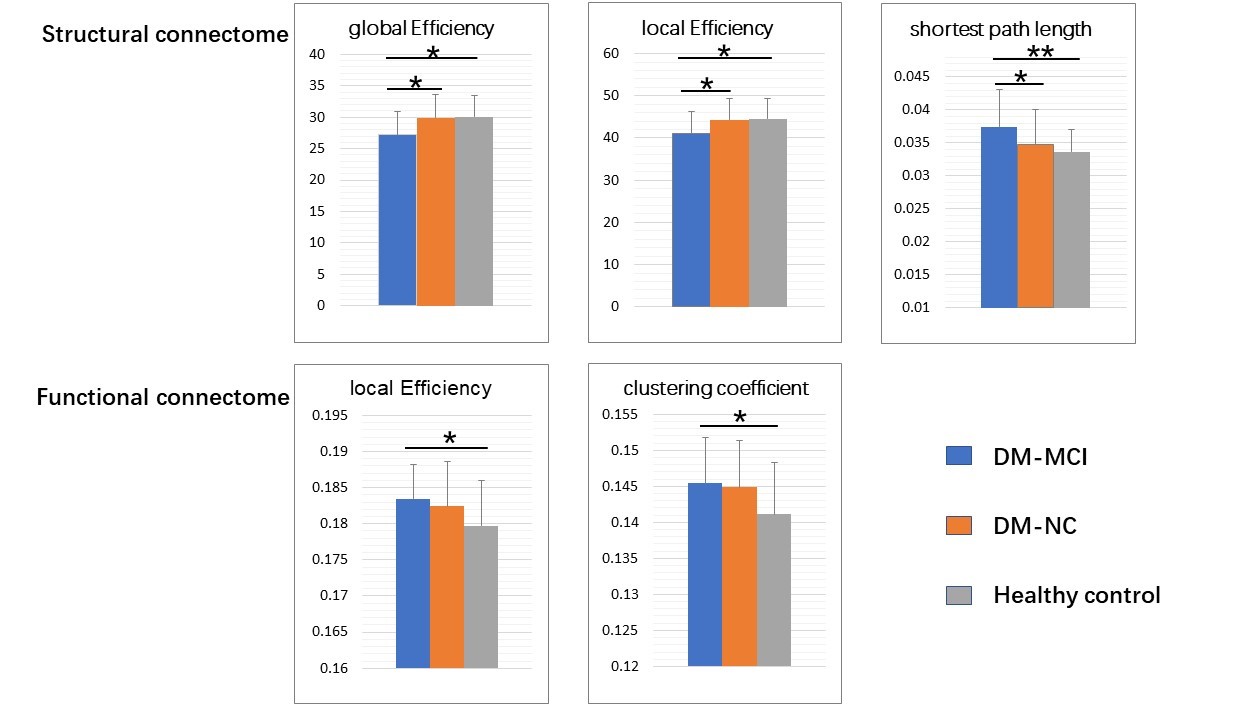
Fig.2 Group differences in the global network
metrics of structural and functional connectomes. The bar and error bar
represent the mean values and standard deviations of the network properties in
each group after removing the
effects of age and gender. (A) Significantly reduced global efficiency
and local efficiency, and increased shortest path length of SC networks were
observed in DM-MCI patients relative to both DM-NC the controls. (B) Increased
local efficiency and clustering of FC networks in DM-MCI patients compared to
controls. *p<0.05; **p<0.01.