Jonathan Scharff Nielsen1, Alejandra Sierra2, Ilya Belevich3, Eija Jokitalo3, and Manisha Aggarwal1
1Department of Radiology and Radiological Science, Johns Hopkins University School of Medicine, Baltimore, MD, United States, 2A.I. Virtanen Institute of Molecular Sciences, University of Eastern Finland, Kuopio, Finland, 3Institute of Biotechnology, University of Helsinki, Helsinki, Finland
1Department of Radiology and Radiological Science, Johns Hopkins University School of Medicine, Baltimore, MD, United States, 2A.I. Virtanen Institute of Molecular Sciences, University of Eastern Finland, Kuopio, Finland, 3Institute of Biotechnology, University of Helsinki, Helsinki, Finland
We combined oscillating gradient diffusion MRI with 3D electron microscopy of control and status epilepticus exhibiting rat hippocampi to elucidate the relative contributions of gray
matter microstructural features to the OGSE measurements by Monte Carlo simulation.
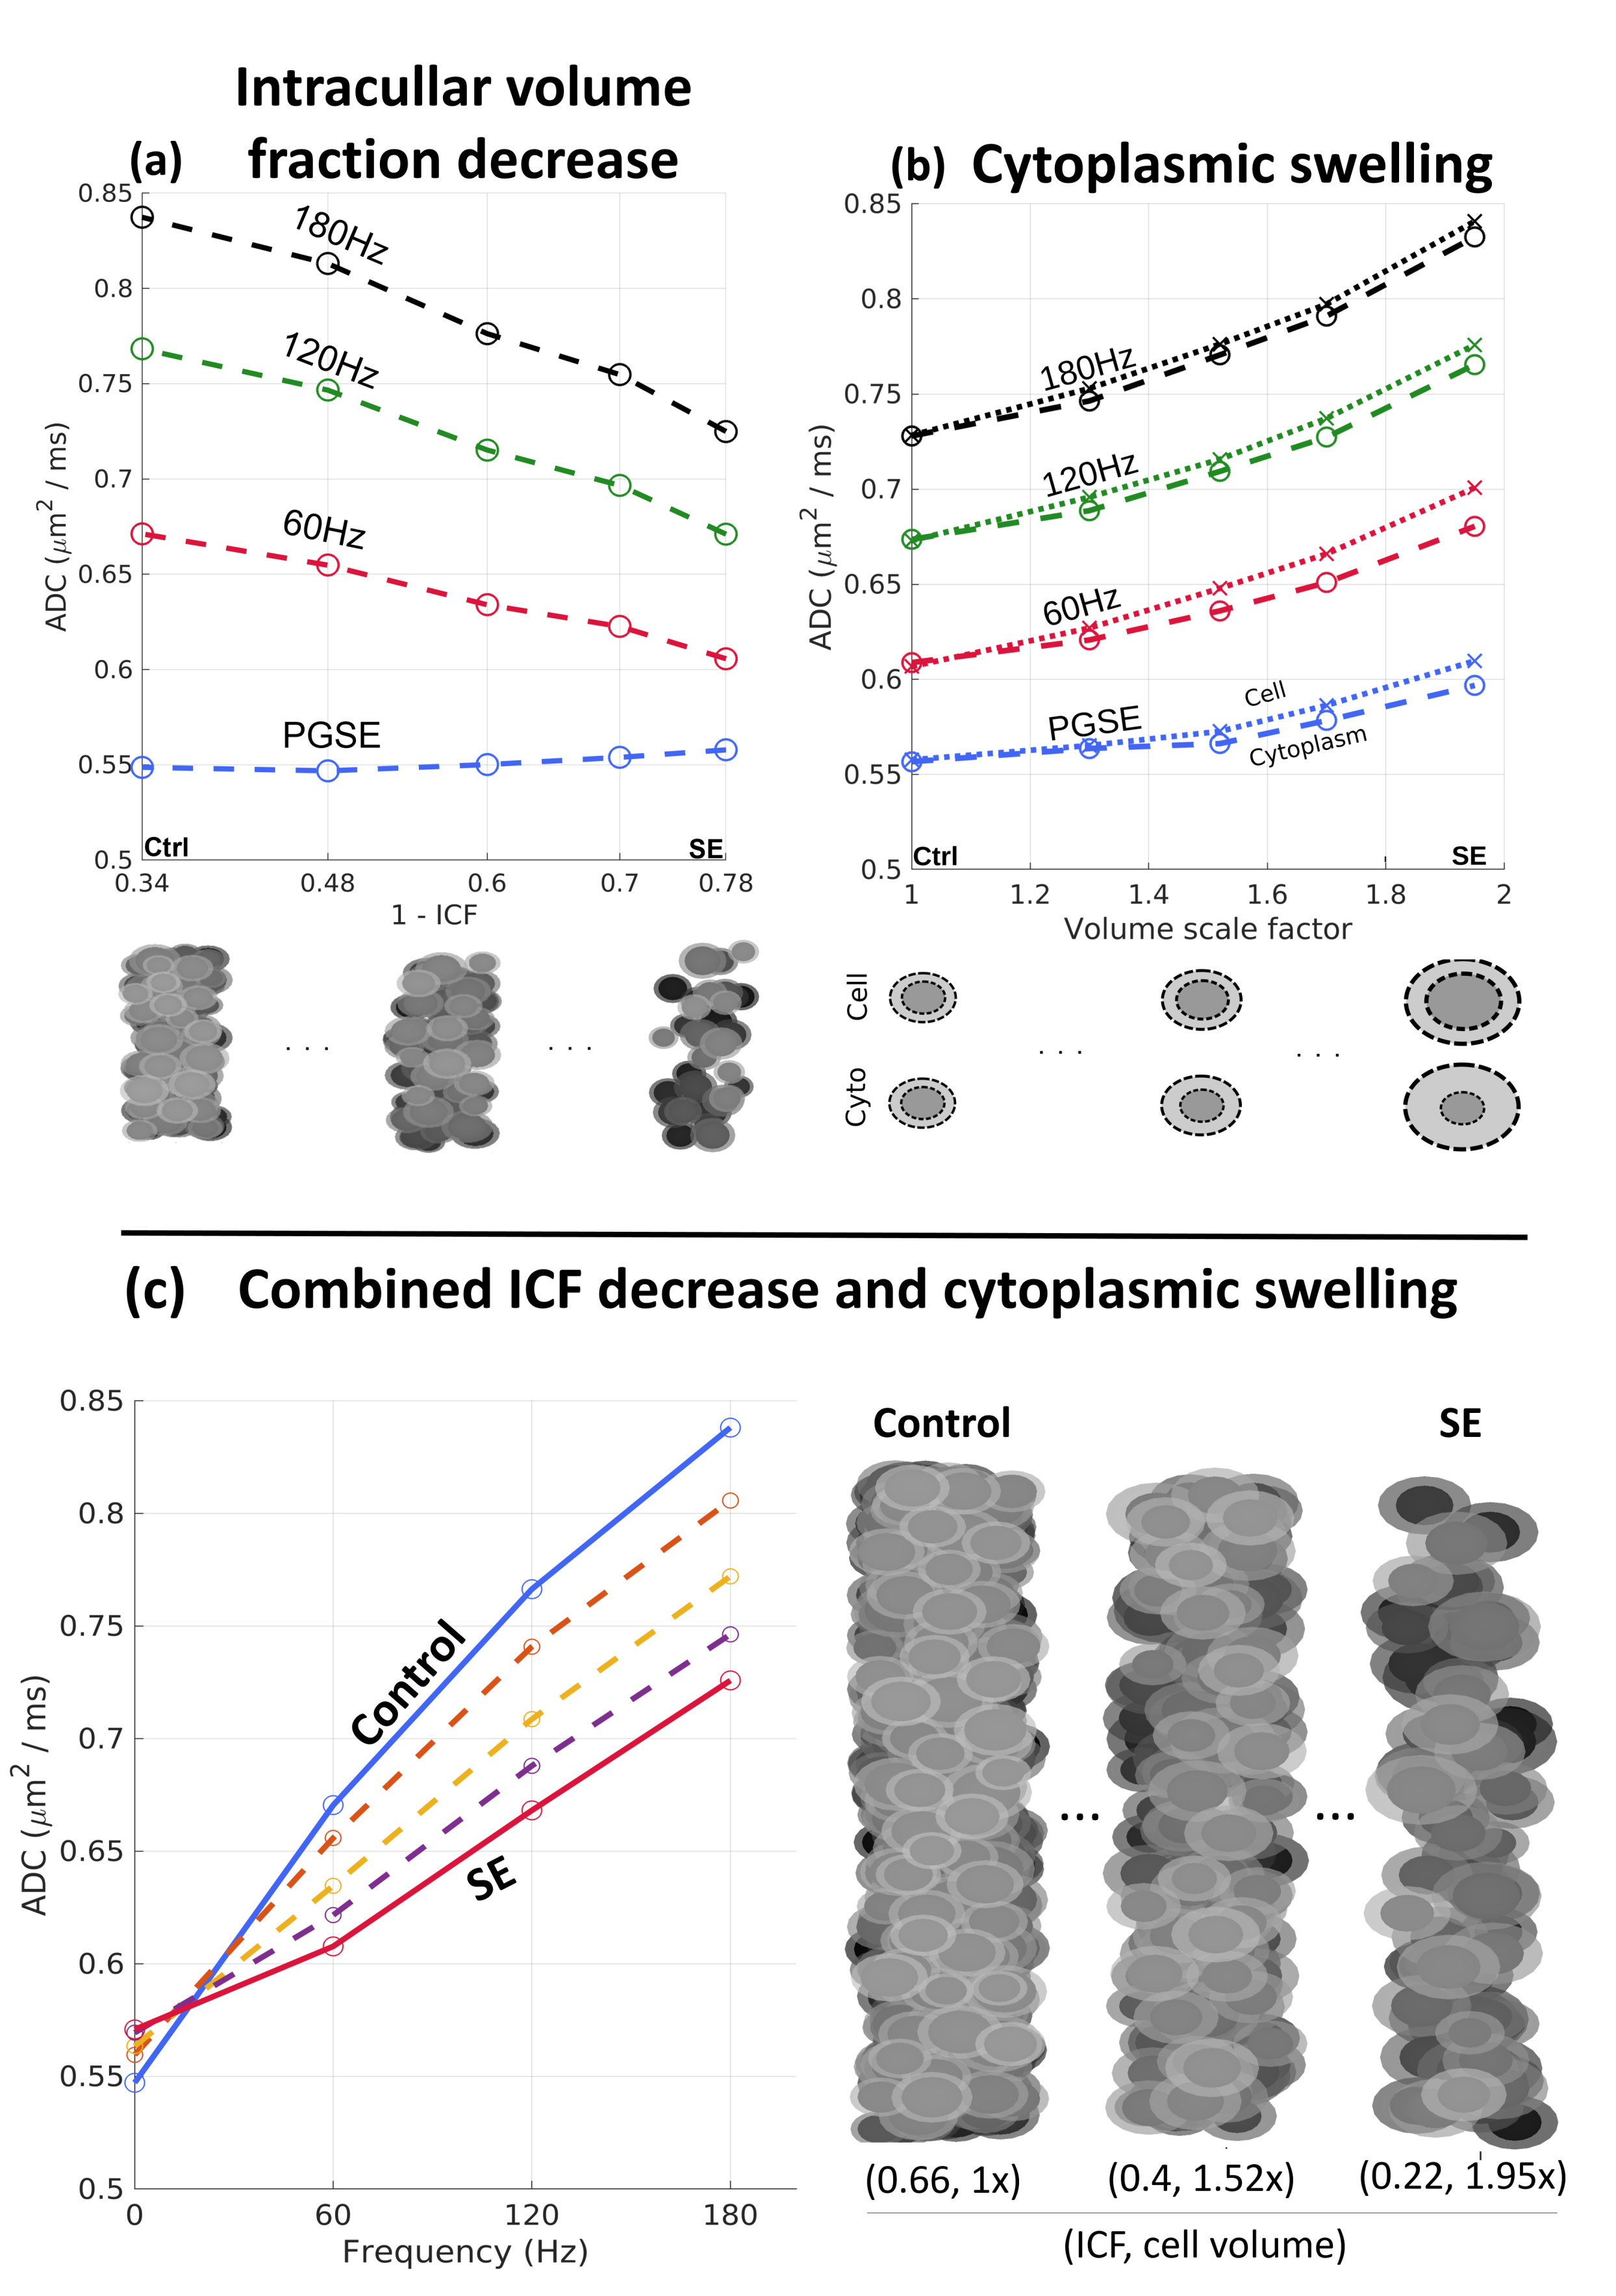
Fig. 4: Simulated
ADC in the PyCA1. a)
ADC as a function of decreasing intracellular fraction (ICF), for
values between the SBEM-derived control and SE data and at a constant
size distribution. b)
ADC as a function of a cell volume, with swelling of a constant
number of cells between the control (1x) and SE (1.95x) size
distributions. Distinct curves are shown for cell vs. cytoplasmic
swelling. c) ADC
vs. frequency curves for the combined effects with simultaneously
decreased ICF and cytoplasmic swelling between the control and SE
SBEM values, reflecting the observed histopathology.
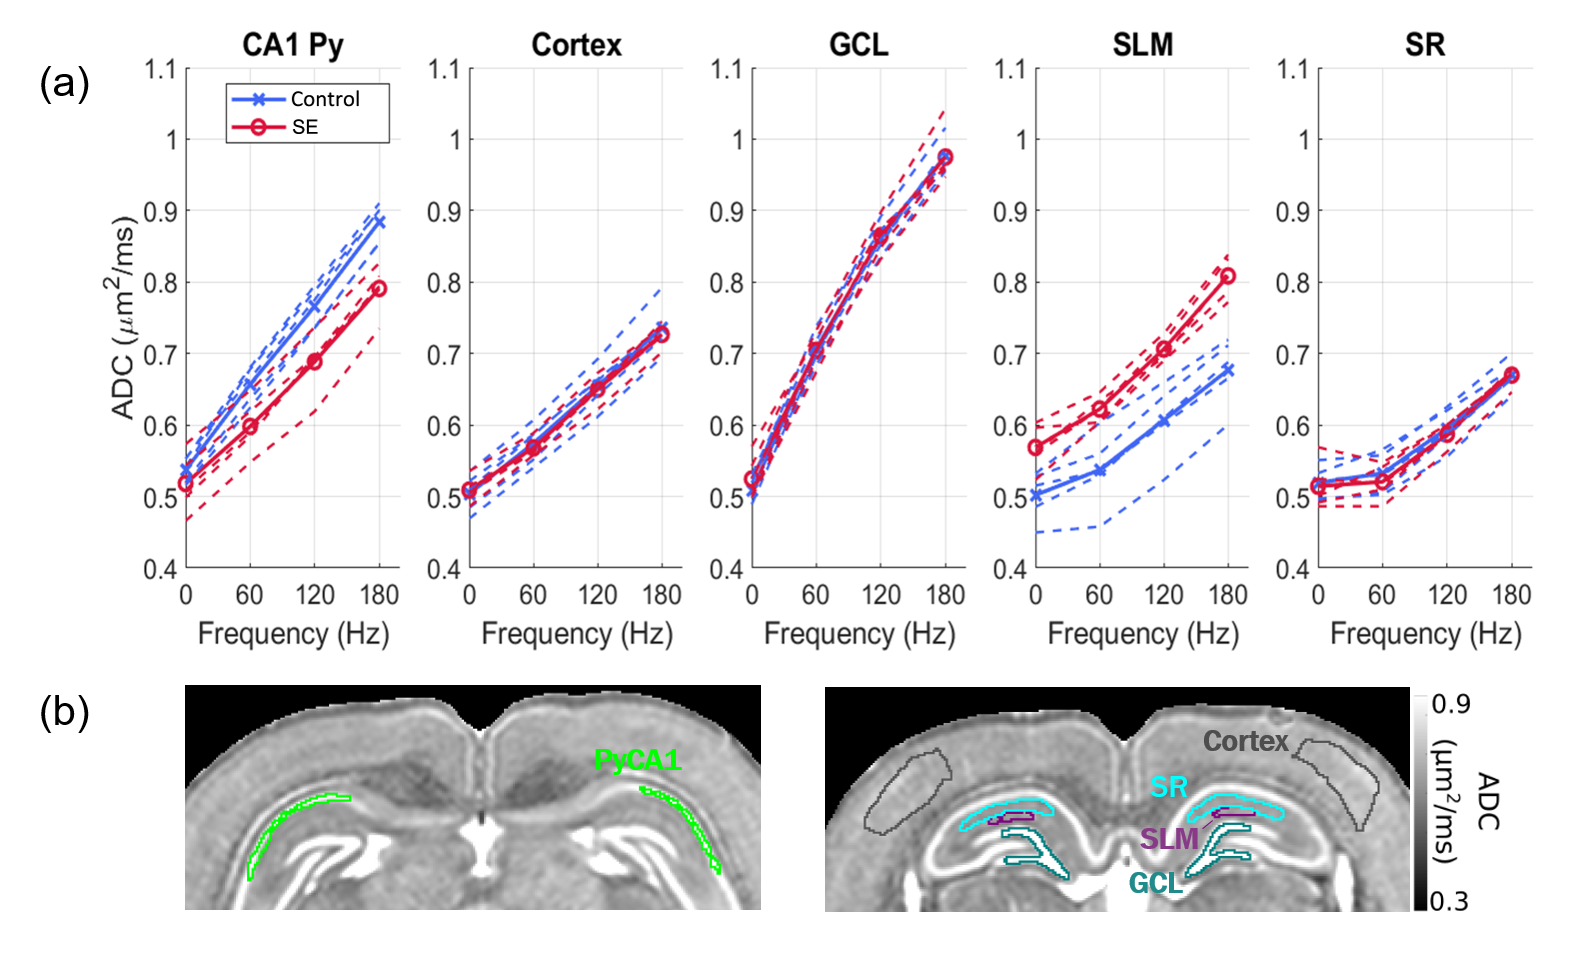
Fig. 1: PGSE
and OGSE dMRI of the control and SE rat hippocampi. 0 Hz is the PGSE
data point. a)
Frequency dependent ADC curves in the following gray matter ROIs show
characteristic differences with increasing frequencies: pyramidal
cell layer of the CA1 (PyCA1); cortex;
granule cell layer of the dentate gyrus (GCL); stratum
lacunosum-moleculare (SLM);
and stratum radiatum (SR). Shown are the average curves (solid) and
the individual rat curves (dashed). b)
The ROI delineations, shown overlaid on the group average ADC map at
180 Hz for control rats.