Luke Xie1, Aaron K Wong2, Rohan S. Virgincar1, Patrick Caplazi3, Vineela D. Gandham1, Alex J. De Crespigny4, Robby M. Weimer1, and Hans D. Brightbill2
1Biomedical Imaging, Genentech, South San Francisco, CA, United States, 2Translational Immunology, Genentech, South San Francisco, CA, United States, 3Pathology, Genentech, South San Francisco, CA, United States, 4Clinical Imaging Group, Genentech, South San Francisco, CA, United States
1Biomedical Imaging, Genentech, South San Francisco, CA, United States, 2Translational Immunology, Genentech, South San Francisco, CA, United States, 3Pathology, Genentech, South San Francisco, CA, United States, 4Clinical Imaging Group, Genentech, South San Francisco, CA, United States
In an oxalate induced CKD model, we find that MRI FA and AD in the medulla are most correlated with fibrosis pathologies, hydroxyproline, and inflammatory and fibrotic gene expression (Col1a1, Col3a1, Fn1, SerpinE1, IL6, and CCL2).
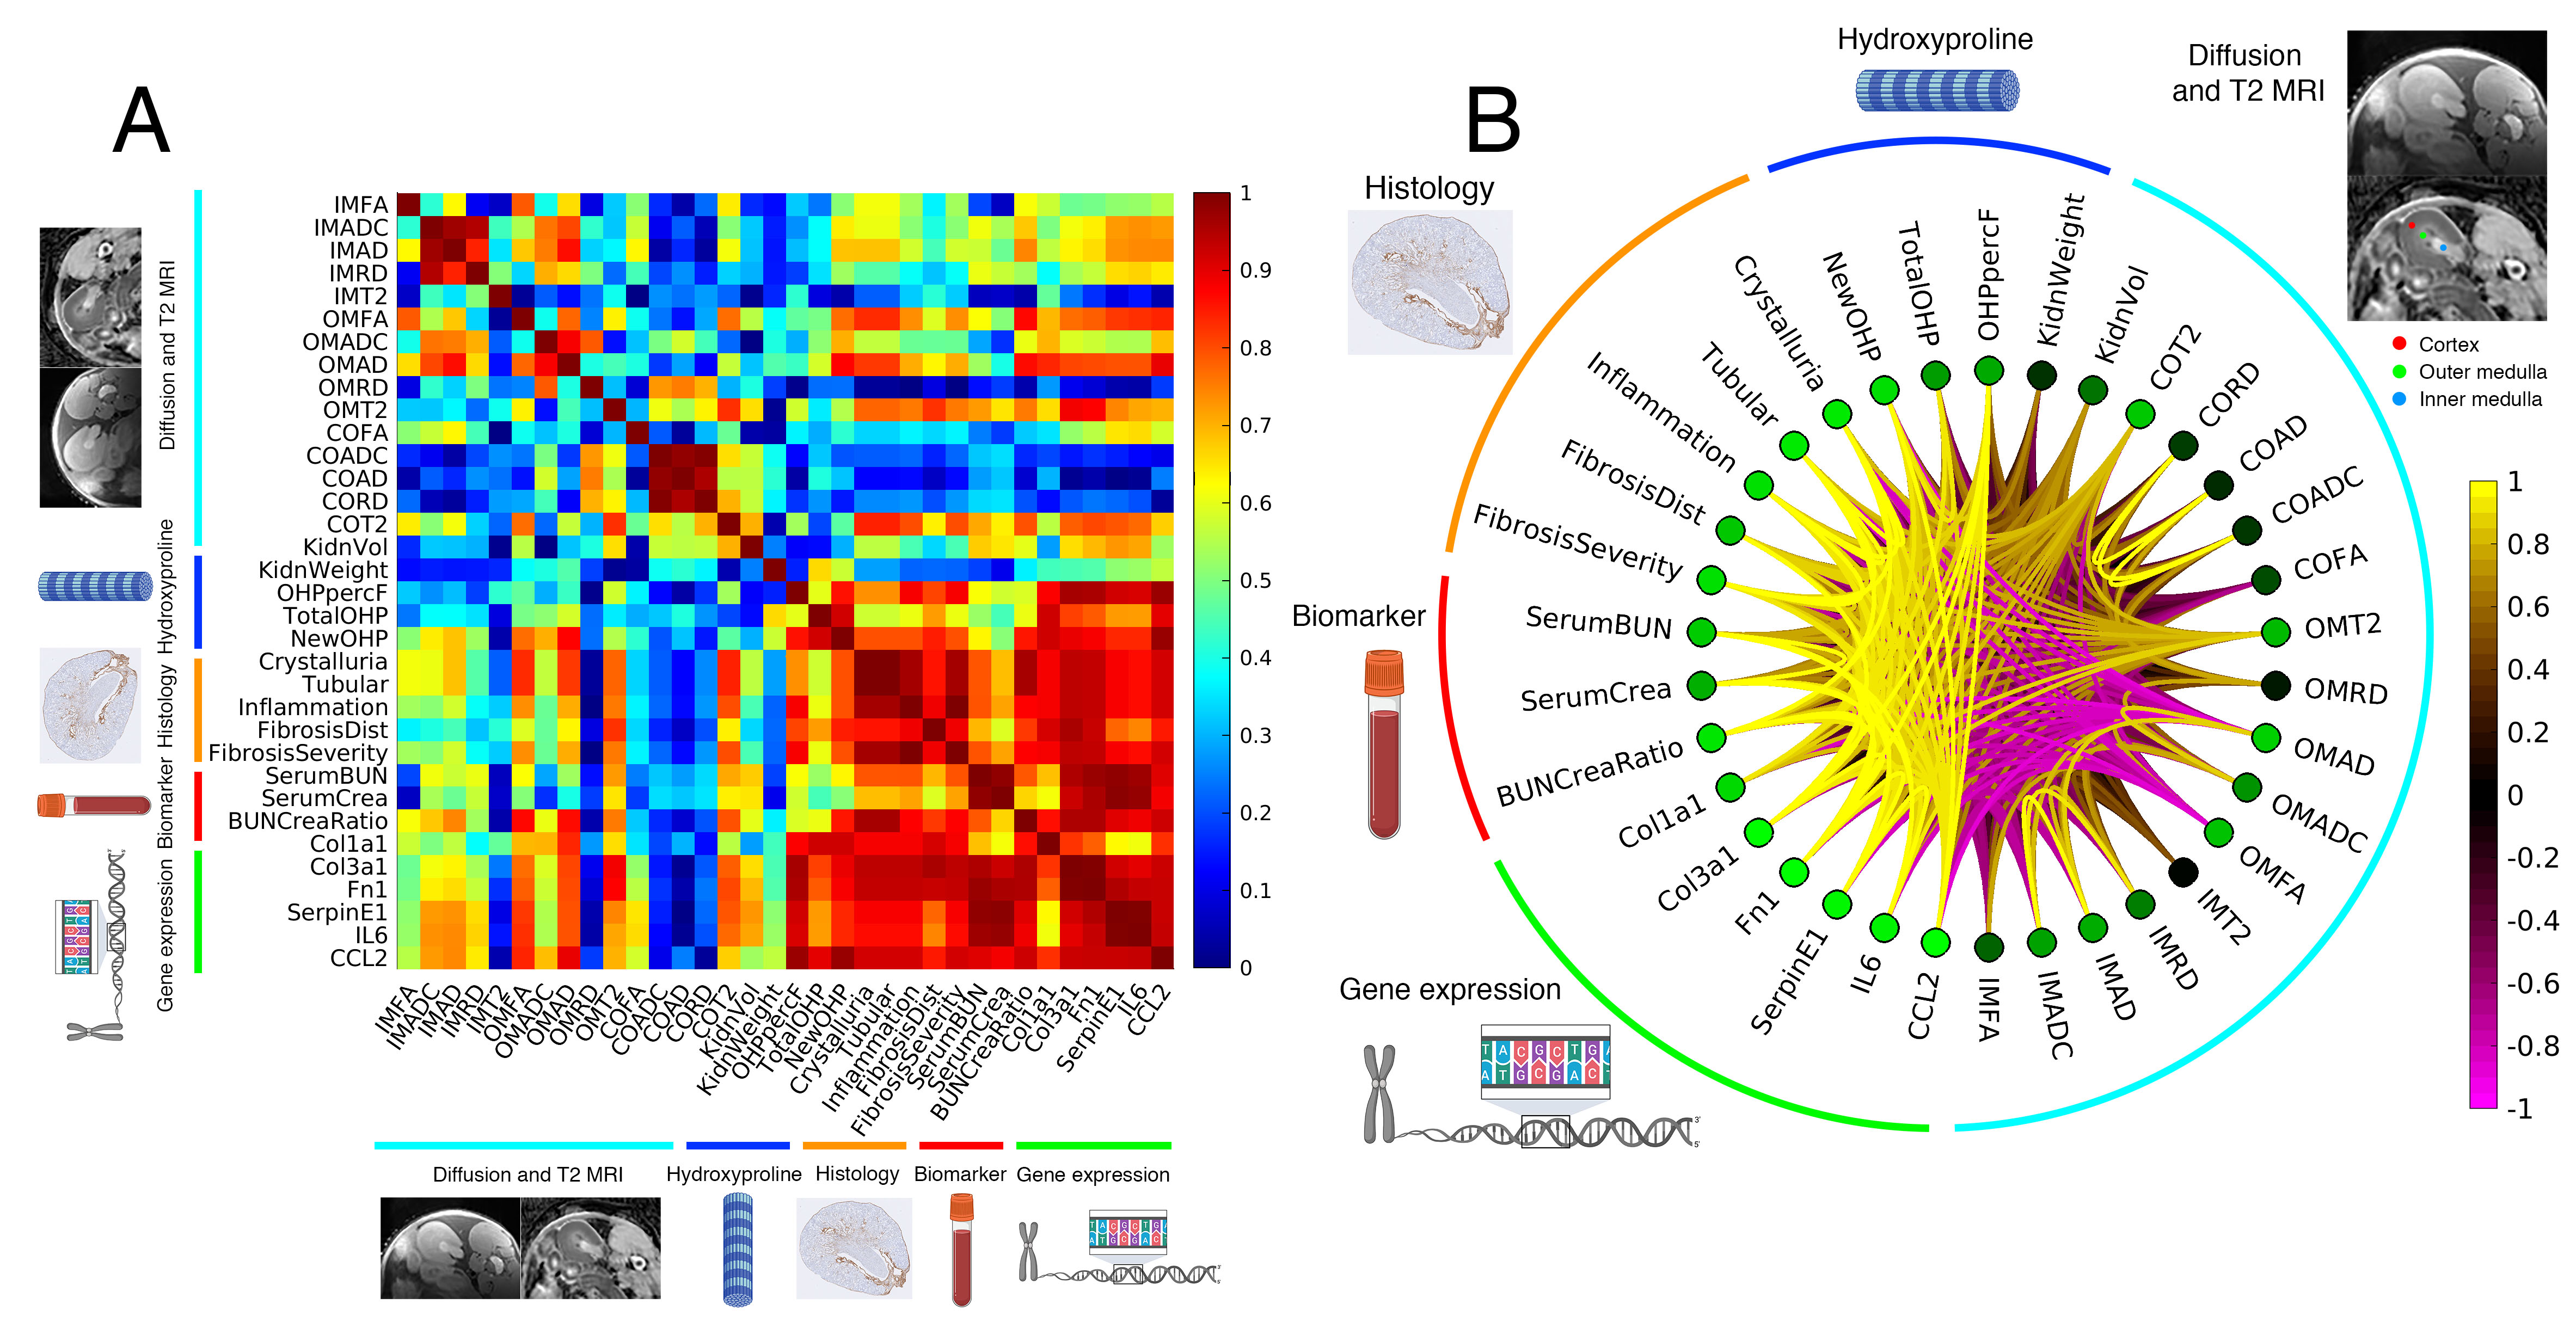
Fig 3. A: Pearson correlation matrix (absolute values) of MRI, hydroxyproline, histology, serum biomarkers, and gene expression data. High correlations are in red and low correlations are in blue. B: Schemaball for all metrics. Curves are colored by correlation between two metrics (magenta = negative correlations and yellow = positive correlations). Green nodes represent cumulative correlation between the individual metric and all other metrics. Control n=5 and oxalate n=8 for all data points except for gene expression (control n=5, oxalate n=4).
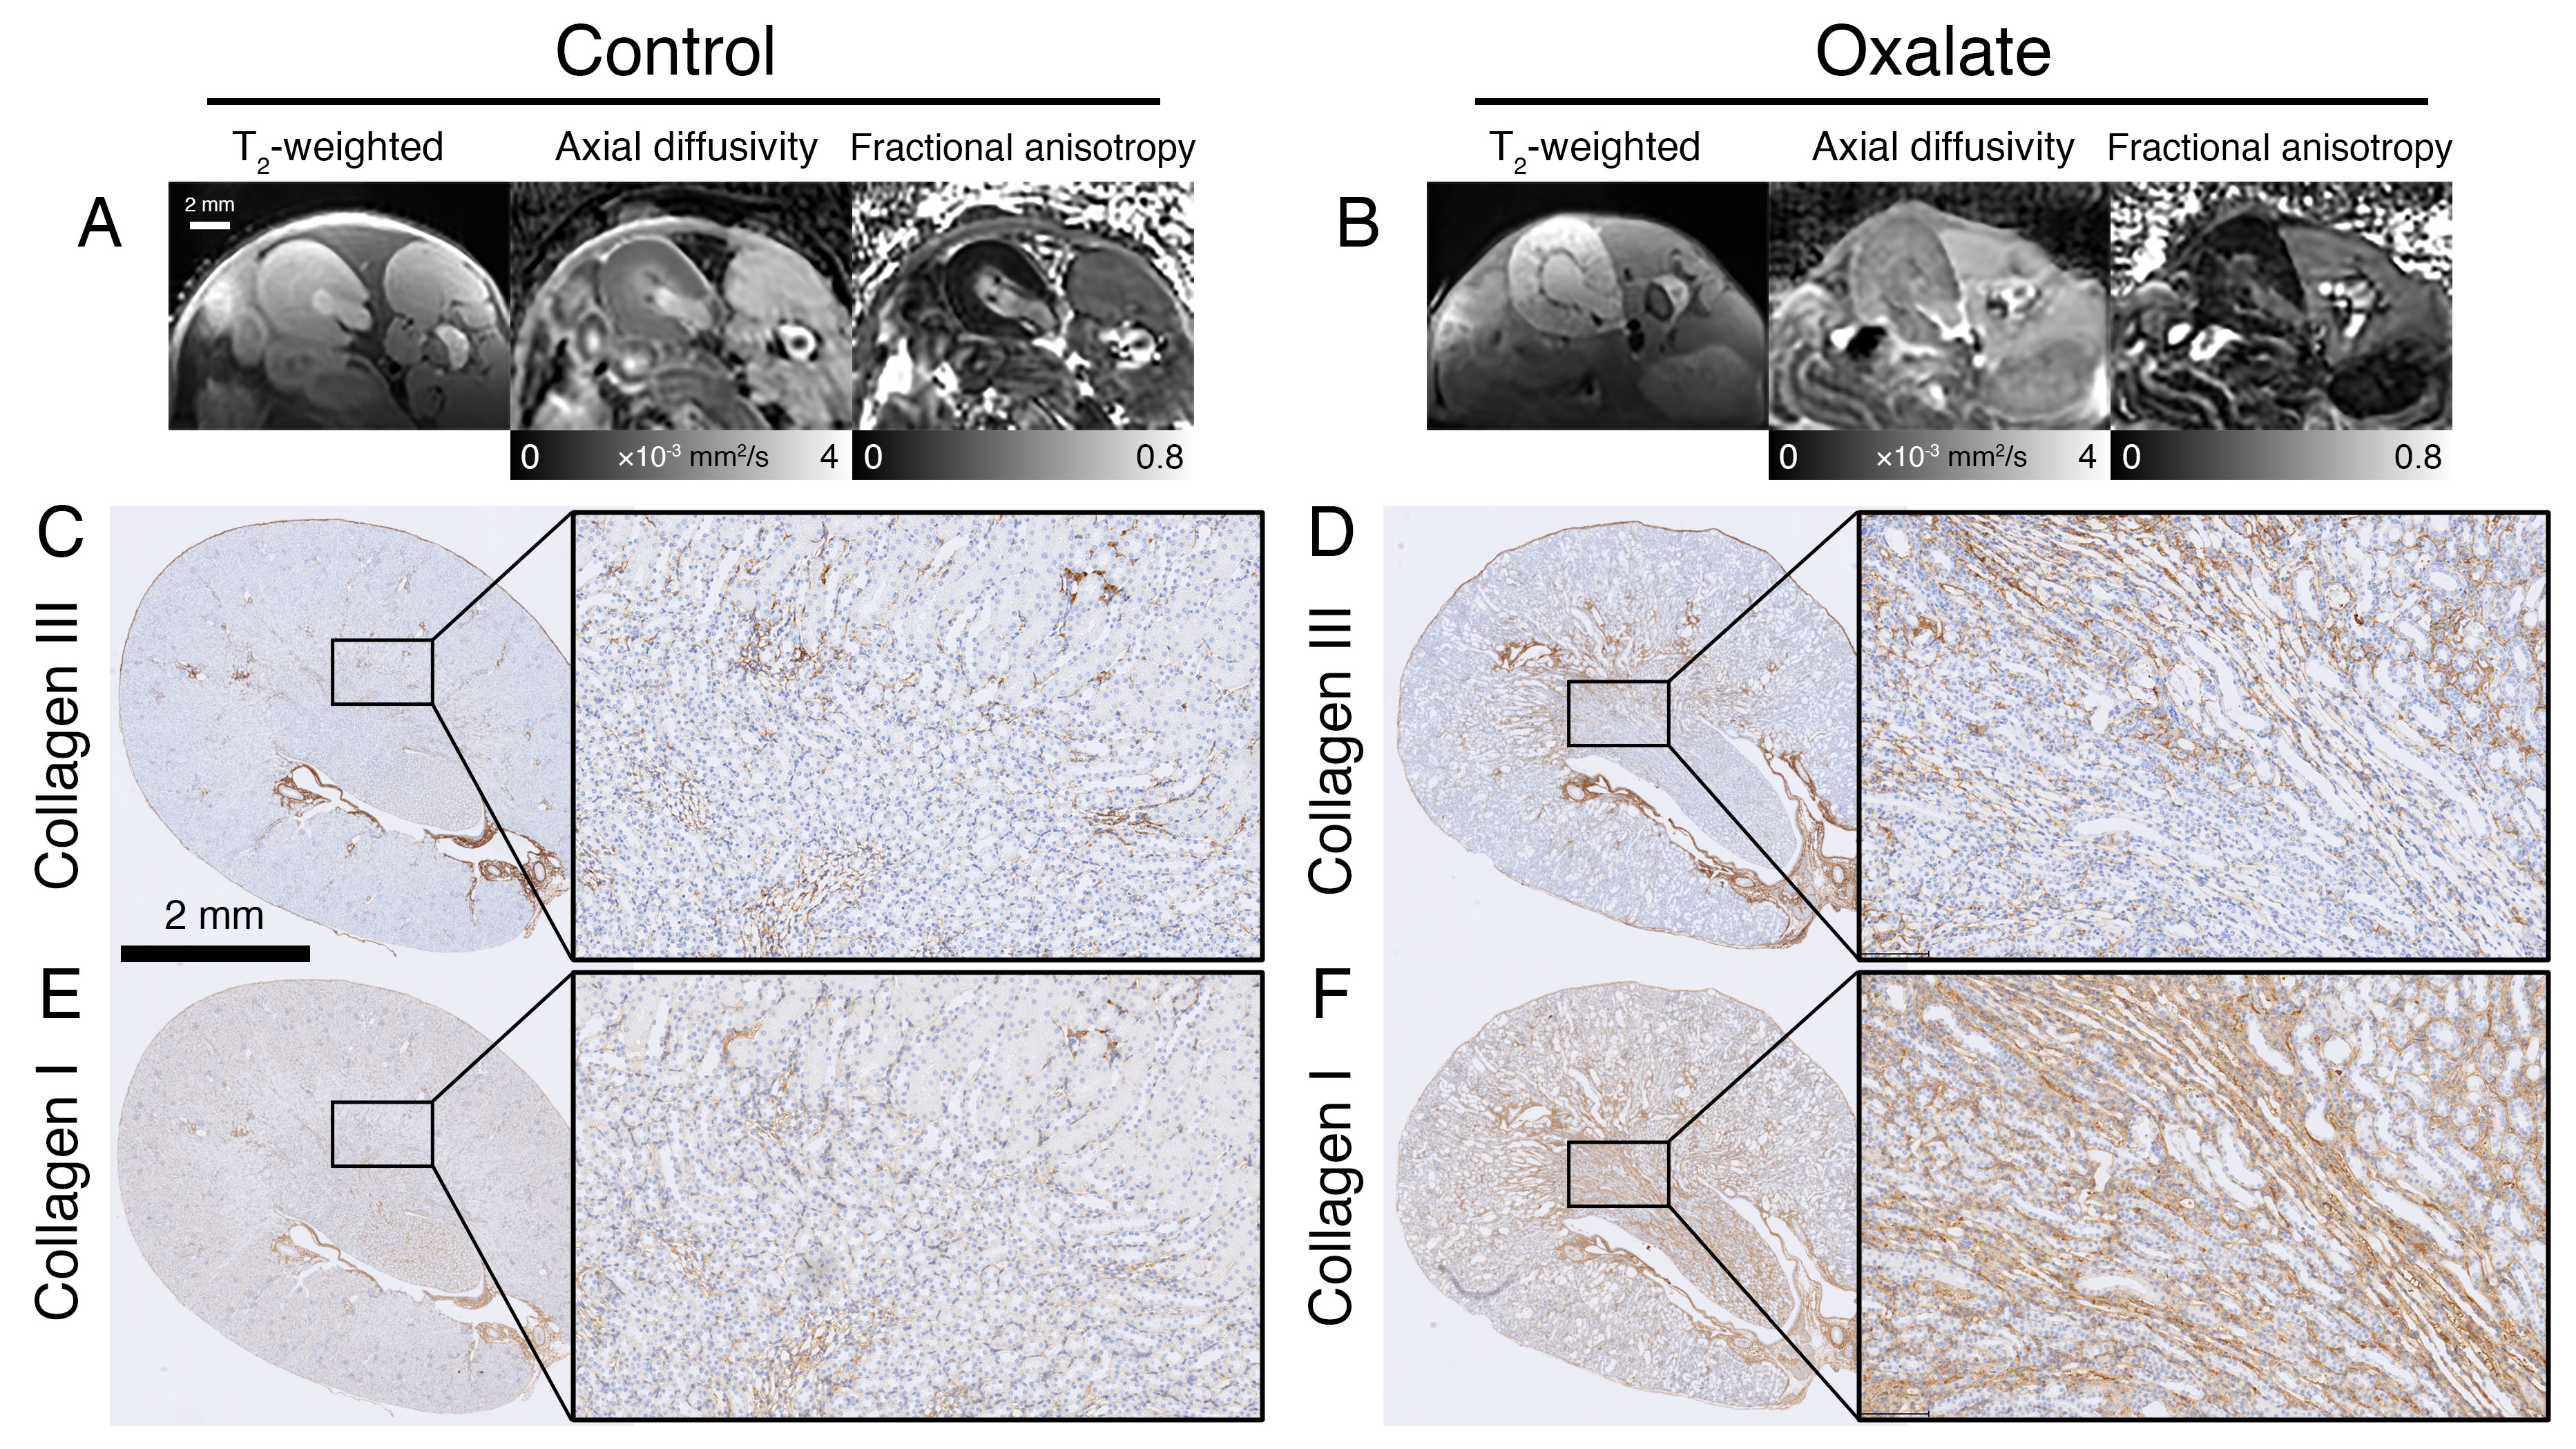
Fig. 1. Images of control and oxalate fed mouse kidneys. T2-weighted, axial diffusivity, and fractional anisotropy of control (A) and oxalate kidneys (B). Collagen III histology of control (C) and oxalate kidneys (D). Collagen I histology of control (E) and oxalate kidneys (F). Histology insert images are shown at 5× magnification. Control n=5 and oxalate n=8. Scalebar = 2mm.