Thomas MacLennan1, Peter Seres1, Julia Rickard1, Emily Stolz1, Christian Beaulieu1, and Alan H. Wilman1
1Biomedical Engineering, University of Alberta, Edmonton, AB, Canada
1Biomedical Engineering, University of Alberta, Edmonton, AB, Canada
After transforming 373 brain $$$B_1^+$$$ maps acquired at 3T to a standard space, $$$B_1^+$$$ was found to be similar across subjects with a whole brain mean CoV of 3.65%. Slight variations were found due to brain size, shape, head orientation, CSF volume, and Tx power calibration.
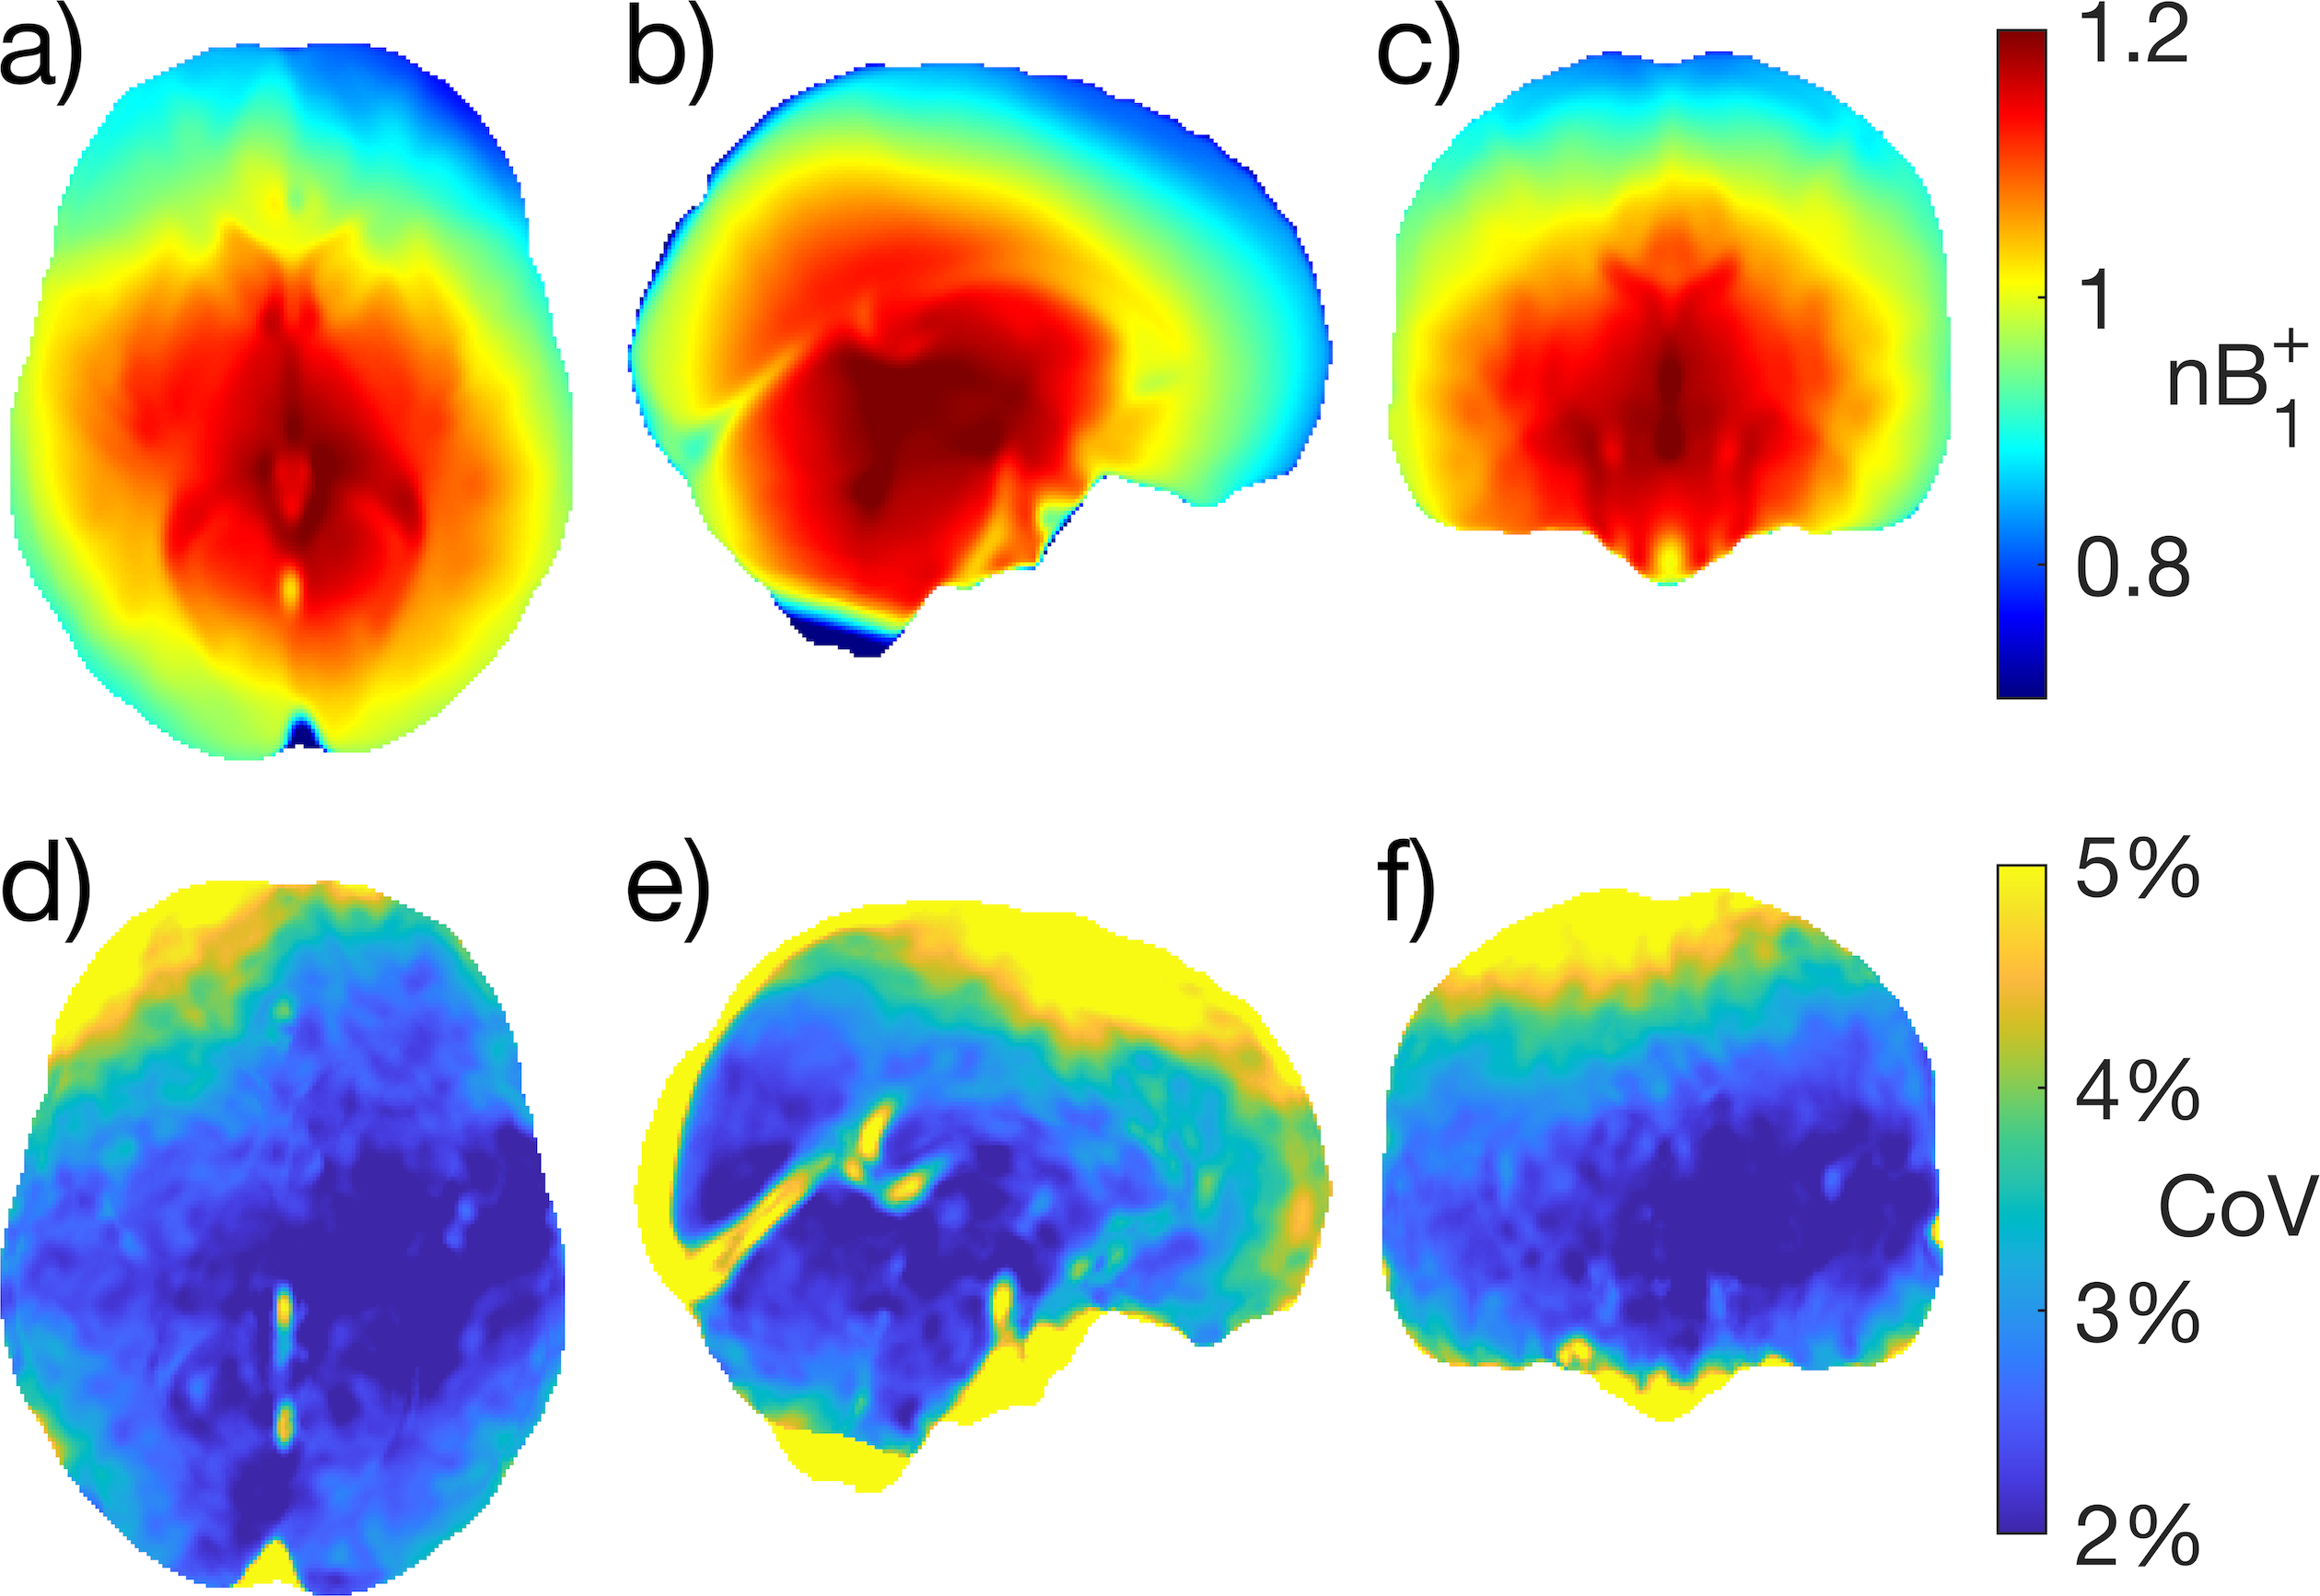
Figure 1: (a-c) show the mean, normalized $$$B_1^+$$$ ($$$nB_1^+$$$ ) map of all 373 subjects in MNI space in axial, sagittal and coronal views. Note that the scale is normalized by the nominal $$$B_1^+$$$ field strength. Images (d-f) show the coefficient of variation (CoV) map in axial, sagittal and coronal views calculated from all 373 subjects.
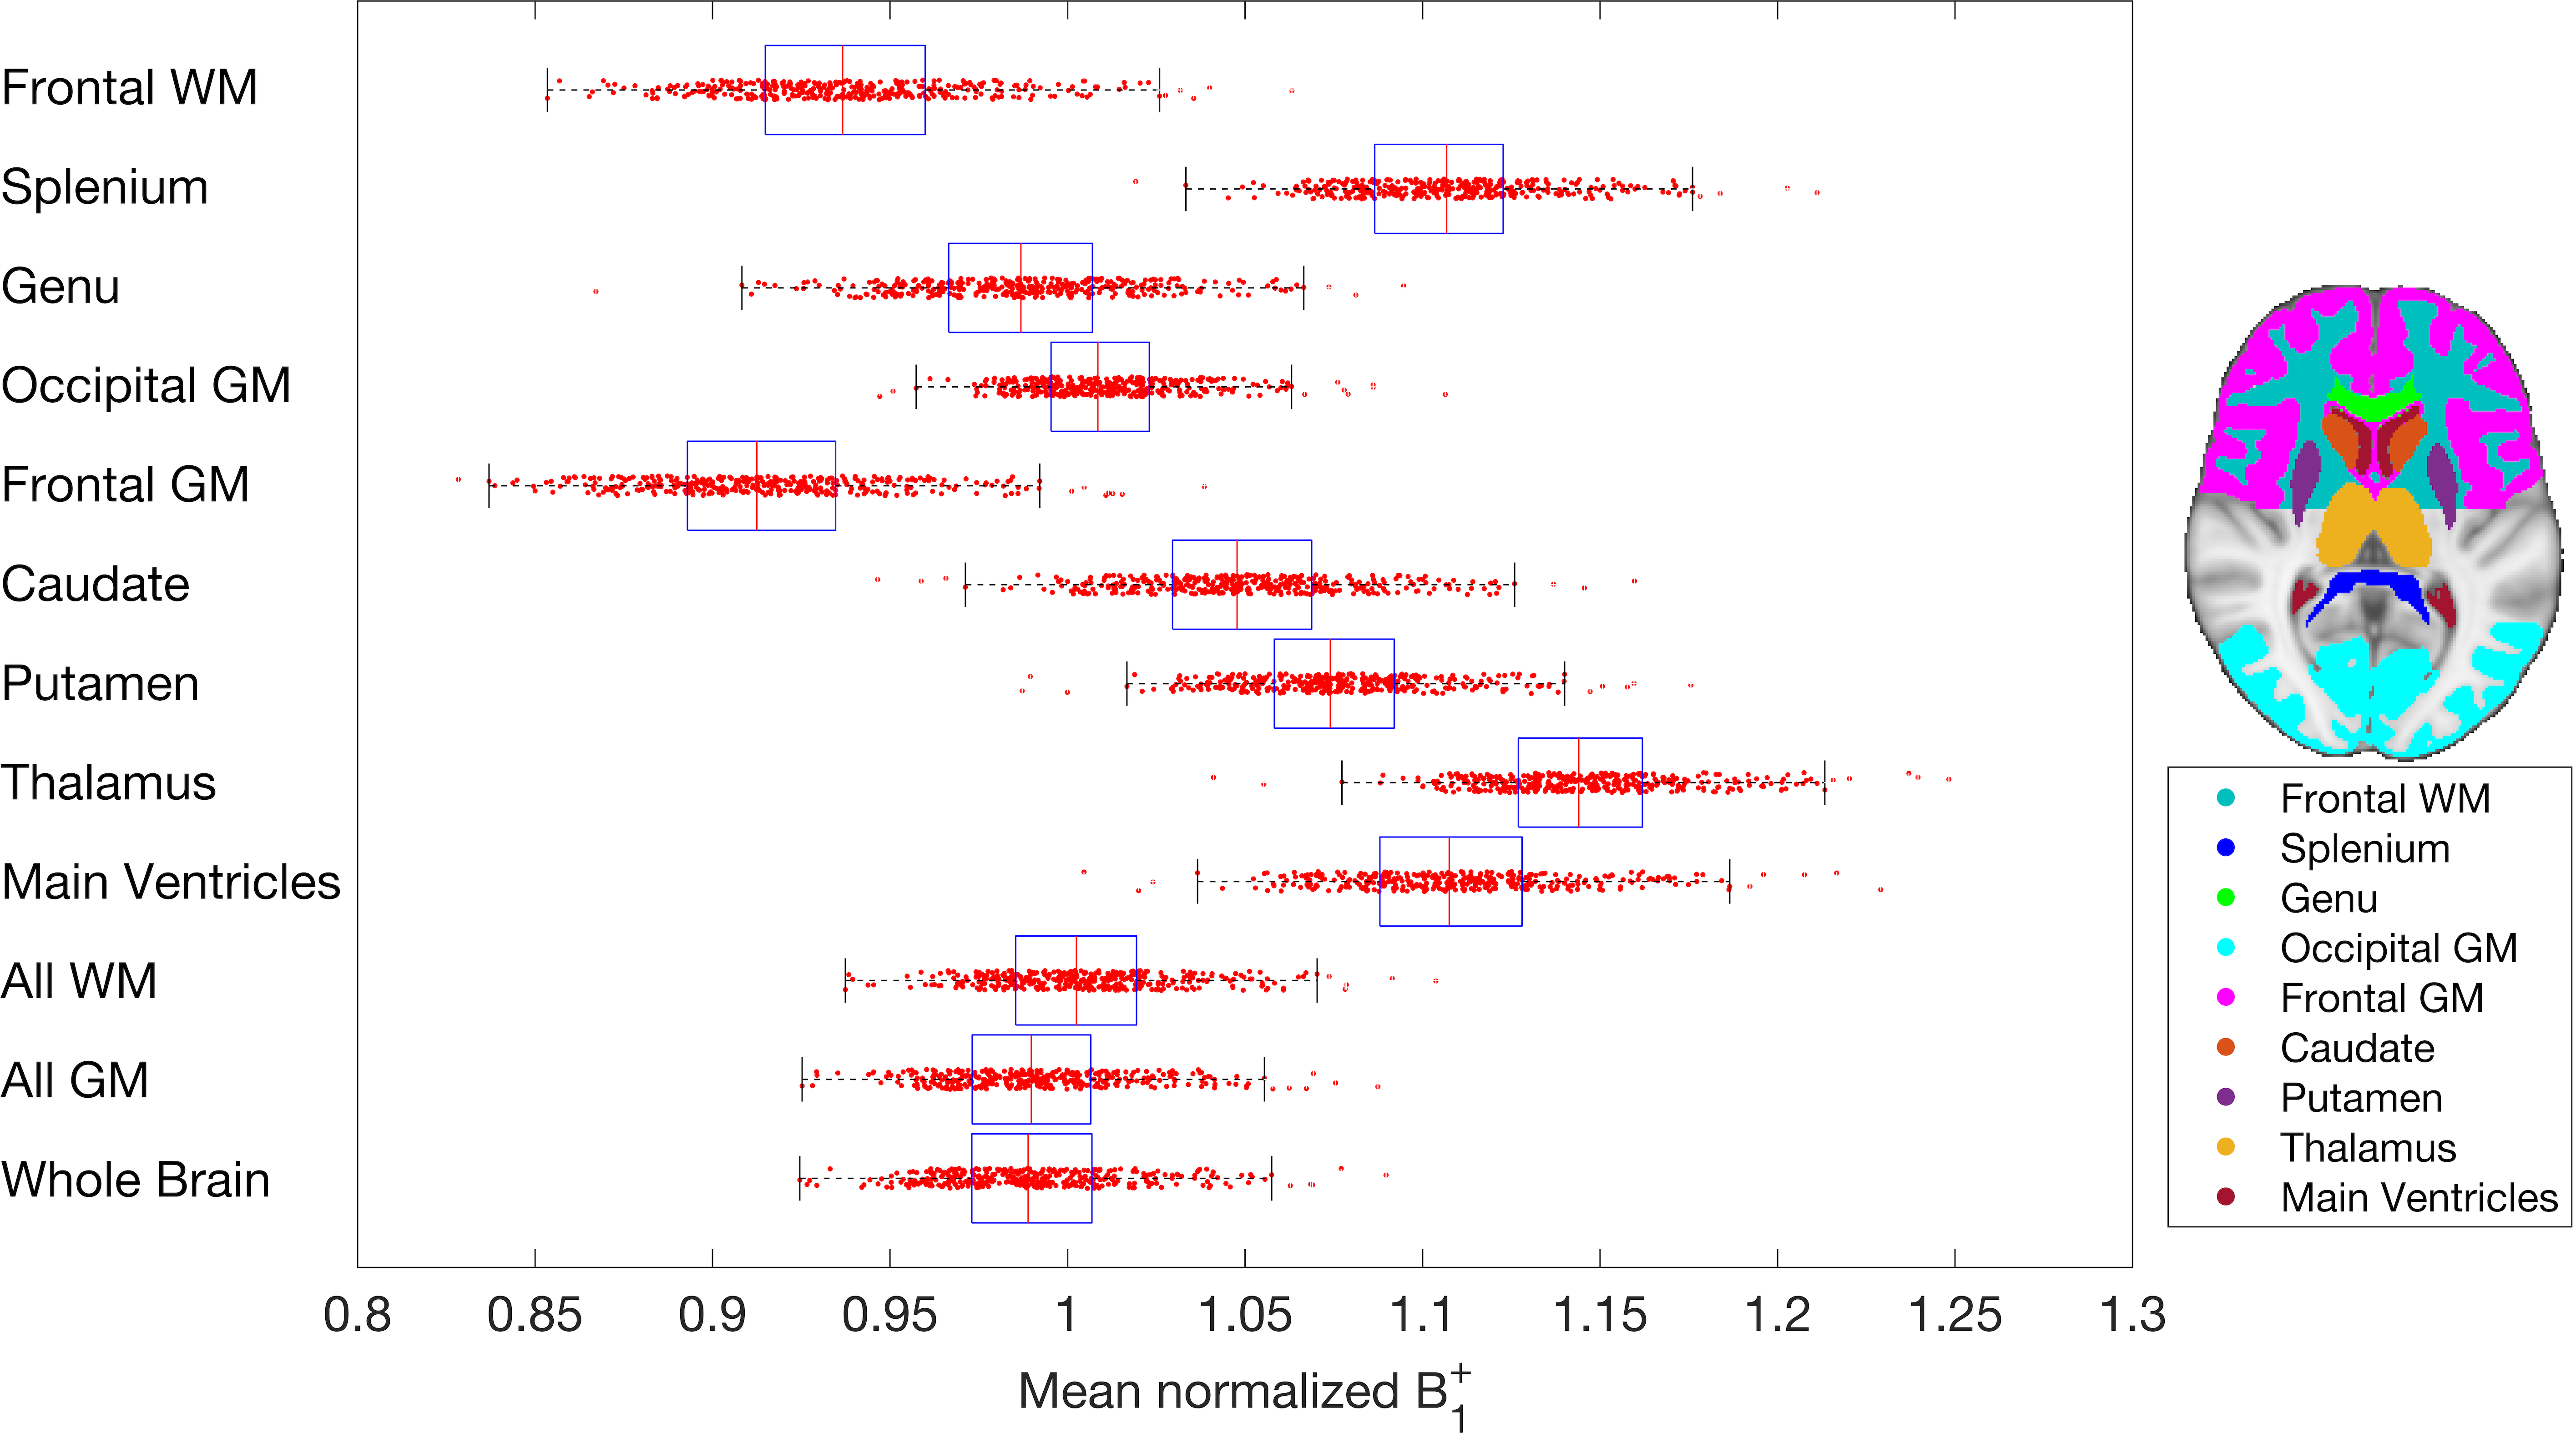
Figure 2: Mean normalized $$$B_1^+$$$ calculated bilaterally for several regions of interest in MNI space. Frontal regions tend to have smaller $$$B_1^+$$$, while central regions have larger $$$B_1^+$$$. The central mark on each box represents the median and the left and right edges represent the 25th and 75th percentiles, respectively. Maximum and minimum, excluding outliers, are marked by the whiskers with all data points scattered across the boxes.