Jiayue (Cherry) Cao1, Xiaokai Wang1, Yizhen Zhang2, and Zhongming Liu1,2
1Biomedical Engineering, University of Michigan, ANN ARBOR, MI, United States, 2Electrical Engineering and Computer Science, University of Michigan, ANN ARBOR, MI, United States
1Biomedical Engineering, University of Michigan, ANN ARBOR, MI, United States, 2Electrical Engineering and Computer Science, University of Michigan, ANN ARBOR, MI, United States
We identify a resting state network encoding the frequency and power fluctuations of the gastric slow wave – a rhythmic activity pacing the stomach. Key regions in this network are the insula, cingulate cortex and the prefrontal cortex.

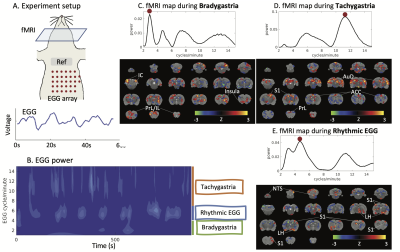
Figure 1. Simultaneous recording of EGG and brain fMRI reveals distinct fMRI maps at different gastric conditions. (A) layouts of the 32-channel electrode array for EGG recording and plotted an example of EGG time series. (B) shows the power fluctuations of EGG at different frequencies. (CDE) are averaged fMRI maps during bradygastria, tachygastria, and rhythmic condition, together with examples of the power-frequency relationship curve. In fMRI maps, color encodes z-value that obtained by the distribution of fMRI intensity from the whole brain.

Figure 2. The EGG power network of the rhythmic EGG. (A) we assume that EGG power is extrinsic stimuli to the BOLD activity. We can estimate the response function H based on EGG power and the BOLD activity. According to the robustness of H, we can map the corresponding EGG power network. (B) shows the EGG power network at 5CPM. Color encodes t-score. The EGG power covers the nucleus of the solitary tract (NTS), spinal vestibular nucleus (SpVe), thalamic nucleus (VM), amygdala (APir), somatosensory cortex (S1BF), insular cortex (AIP), striatum (Cpu), orbital cortex (VO/LO.