Linda Heskamp1, Matthew Birkbeck1,2,3, Roger Whittaker1, Ian Schofield1, and Andrew Blamire1
1Newcastle University Translational and Clinical Research Institute (NUTCRI), Newcastle University, Newcastle upon Tyne, United Kingdom, 2Newcastle Biomedical Research Centre, Newcastle University, Newcastle upon Tyne, United Kingdom, 3Northern Medical Physics and Clinical Engineering, Freeman Hospital, Newcastle upon Tyne NHS Foundation Trust, Newcastle upon Tyne, United Kingdom
1Newcastle University Translational and Clinical Research Institute (NUTCRI), Newcastle University, Newcastle upon Tyne, United Kingdom, 2Newcastle Biomedical Research Centre, Newcastle University, Newcastle upon Tyne, United Kingdom, 3Northern Medical Physics and Clinical Engineering, Freeman Hospital, Newcastle upon Tyne NHS Foundation Trust, Newcastle upon Tyne, United Kingdom
MUMRI can measure
twitch profiles of single motor units by altering the timing of electrical
nerve stimulation in relation to the imaging acquisition window. The measured
single motor unit contraction times were close to previously reported values.

Figure 5: IsingleMU A) Video examples of a motor unit (MU; delineated in blue) in a DW
image (top) and PC image (bottom). B) The signal profiles of the MUs in A. Top: Normalised
DW latency profile (top), velocity profile (middle) and displacement profile (bottom)
displayed against time post-stimulus. Start and end of contraction are depicted
in circles. C) The spatial distribution of DW and phase changes for two MUs. Right image: Two
MUs are seen on the DW image (white arrows) and a third MU appears visible on the phase image
(grey arrowhead).
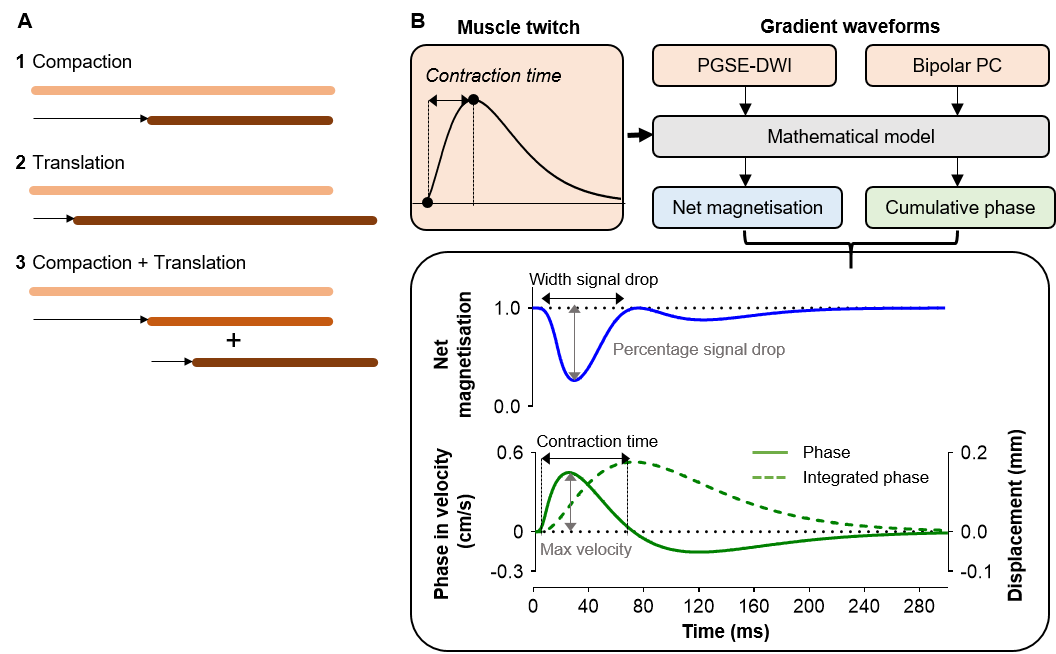
Figure 1: A) Three theoretical
types of muscle contraction. The light orange bar represents the muscle fibre
(or set of elements of magnetisation) before contraction and the dark red bar
the result after contraction. B) Overview of the computational model, including
model input and output (top), and the outcome measures from the simulated net
magnetisation and cumulative phase (bottom). PGSE-DWI is the PGSE diffusion
weighted imaging gradient and Bipolar PC is the bipolar phase contrast gradient.