1Biomedical Magnetic Resonance, Otto-von-Guericke-University Magdeburg, Magdeburg, Germany, 2Department of Neurology, Otto-von-Guericke-University, Magdeburg, Magdeburg, Germany, 3German Center for Neurodegenerative Disease, Magdeburg, Germany, 4Center for Behavioral Brain Sciences, Magdeburg, Germany, 5Leibniz Institute for Neurobiology, Magdeburg, Germany

Figure 1: Data processing workflow: Image data and ROI masks are taken as inputs. Vessels are first enhanced and then segmented. After generating the skeleton, a vessel distance map can be computed by applying the Euclidian distance transform. Local vessel density and VDM estimates are computed from the segmentation and distance maps respectively.
MIP – Maximum Intensity Projection; ROI – Region of Interest; VDM – Vessel Distance Mapping
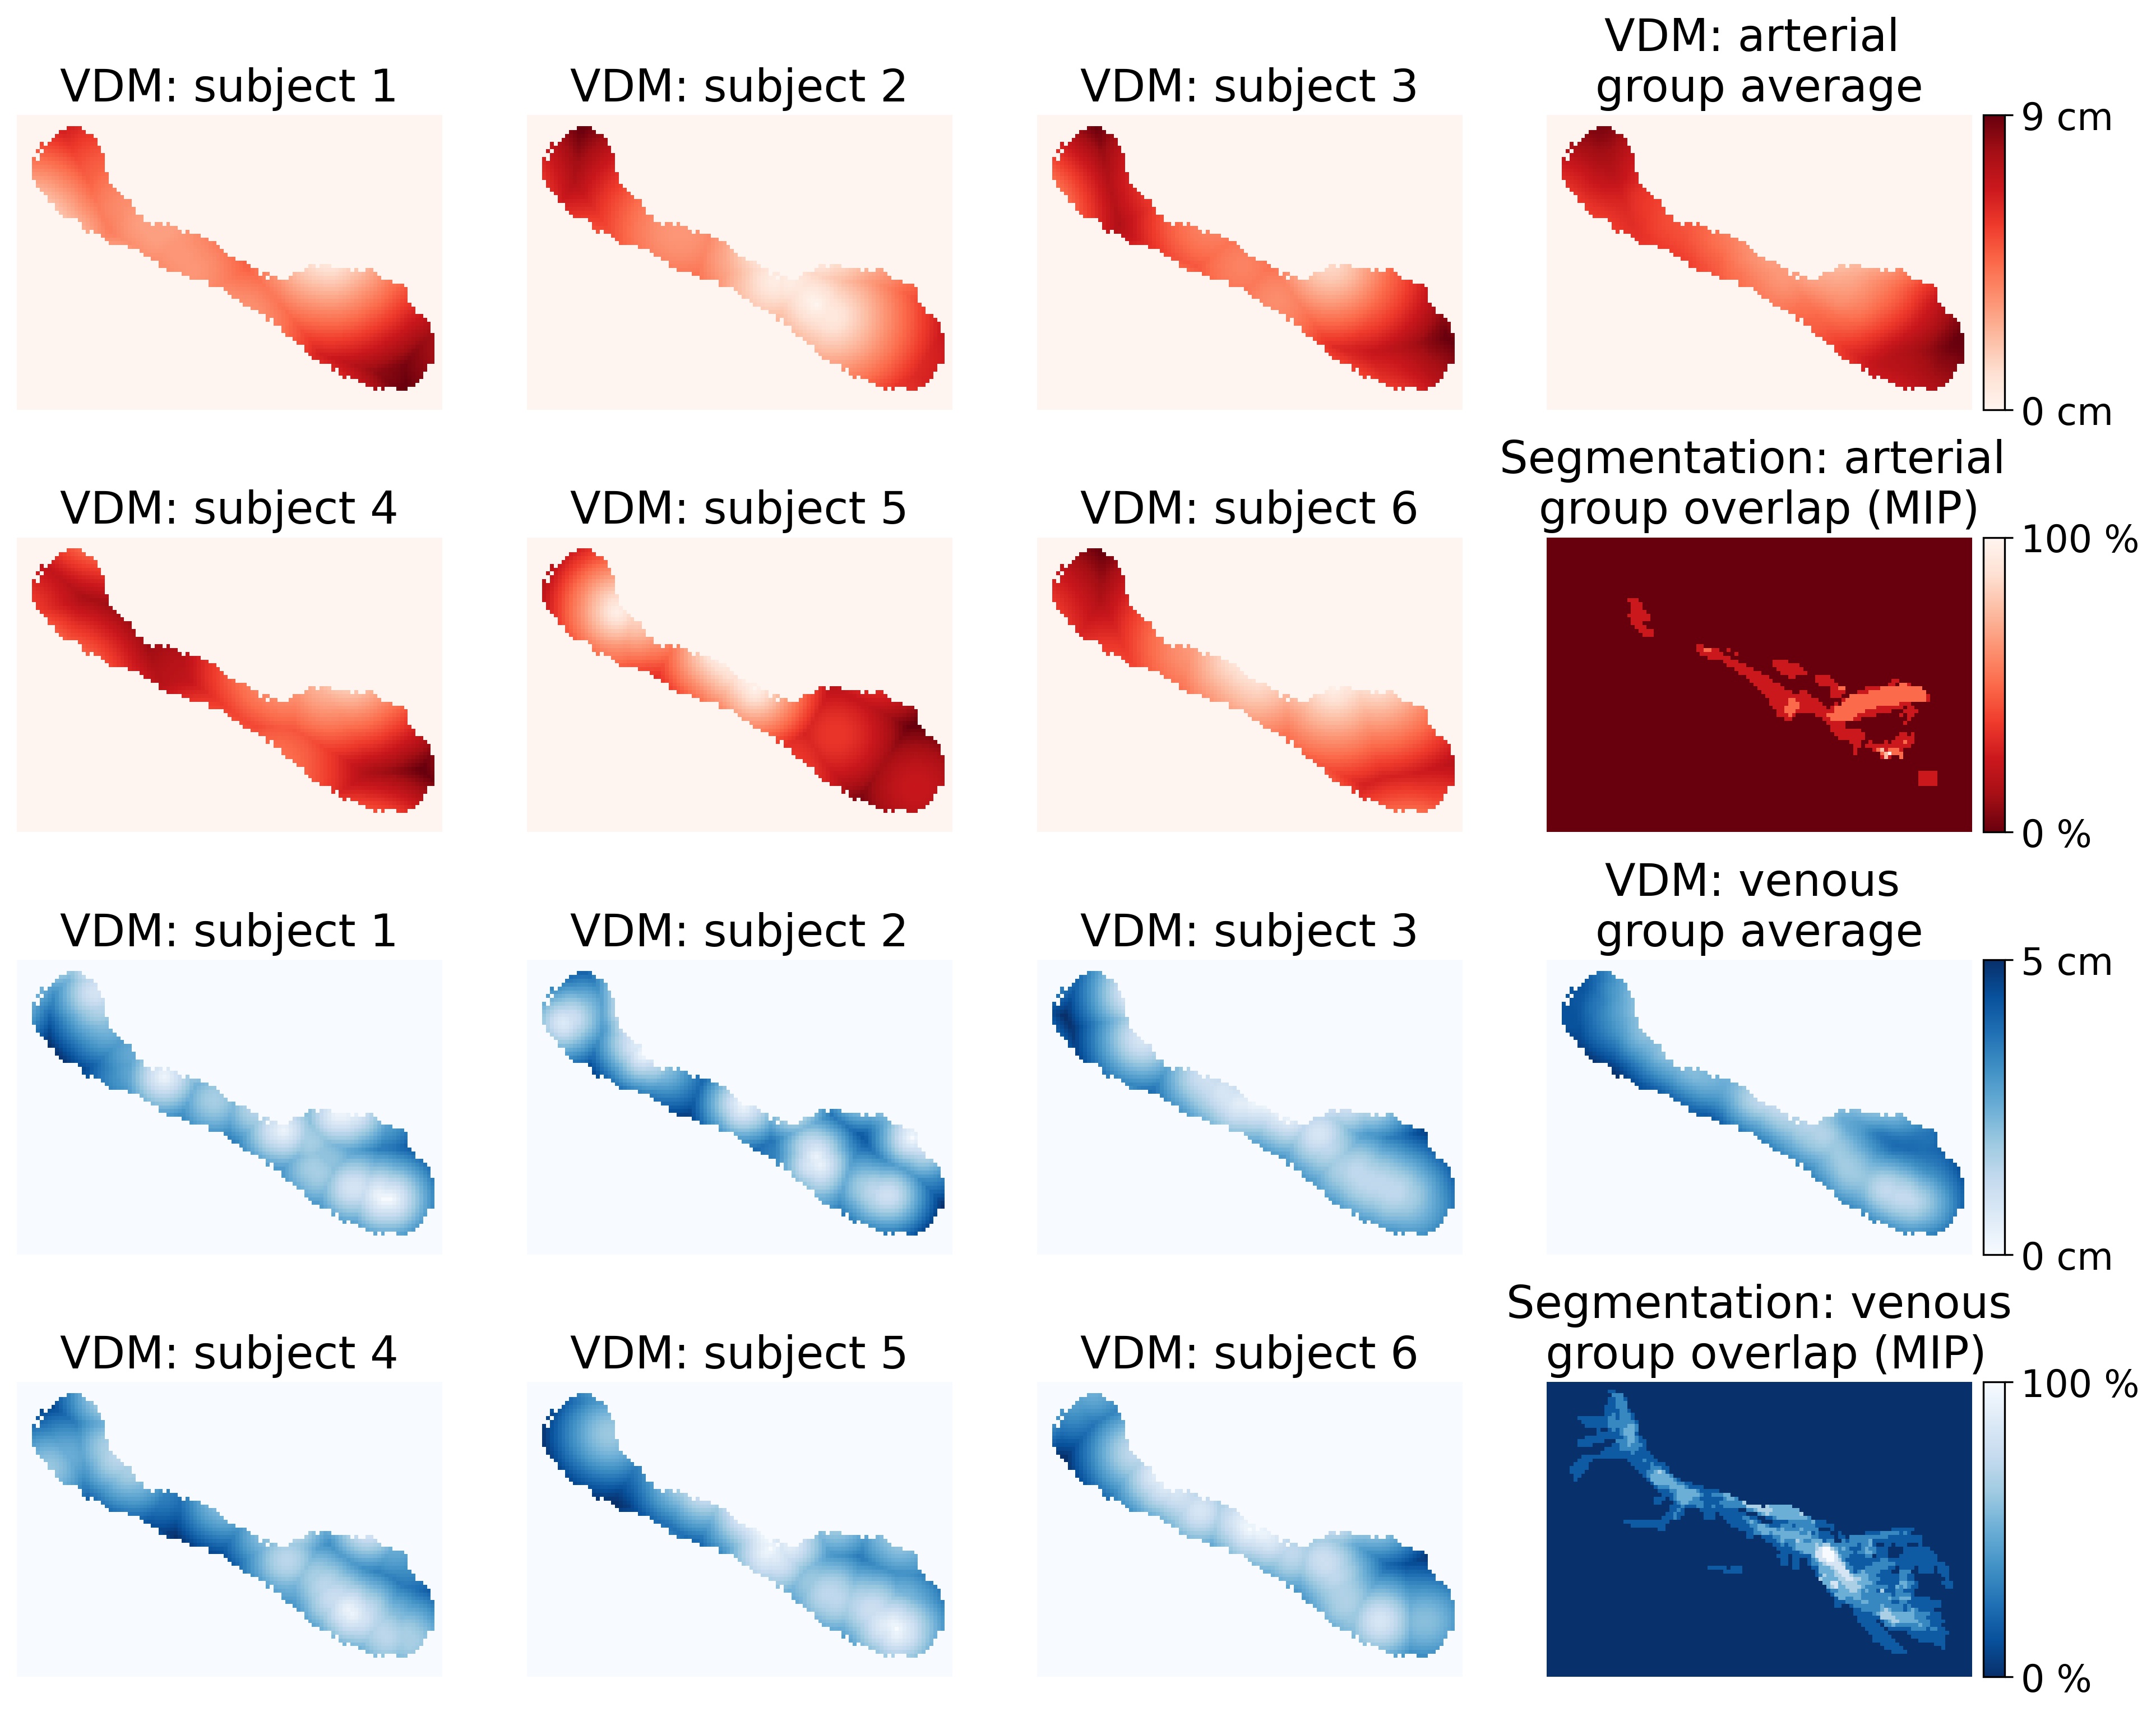
Figure 5: Arterial and venous distance maps of the left hippocampus (central slice shown). By co-registering all subjects to the study template space a group VDM average could be computed. For comparison, all segmentations have been averaged in the template space (shown as MIP) to show the overlap of the vascular patterns.
MIP – Maximum Intensity Projection; VDM – Vessel Distance Mapping