1Radiation Biology Branch, National Cancer Institute, Bethesda, MD, United States, 2Laboratory of Pharmaceutics, Faculty of Pharmacy and Pharmaceutical Sciences, Josai University, Saitama, Japan
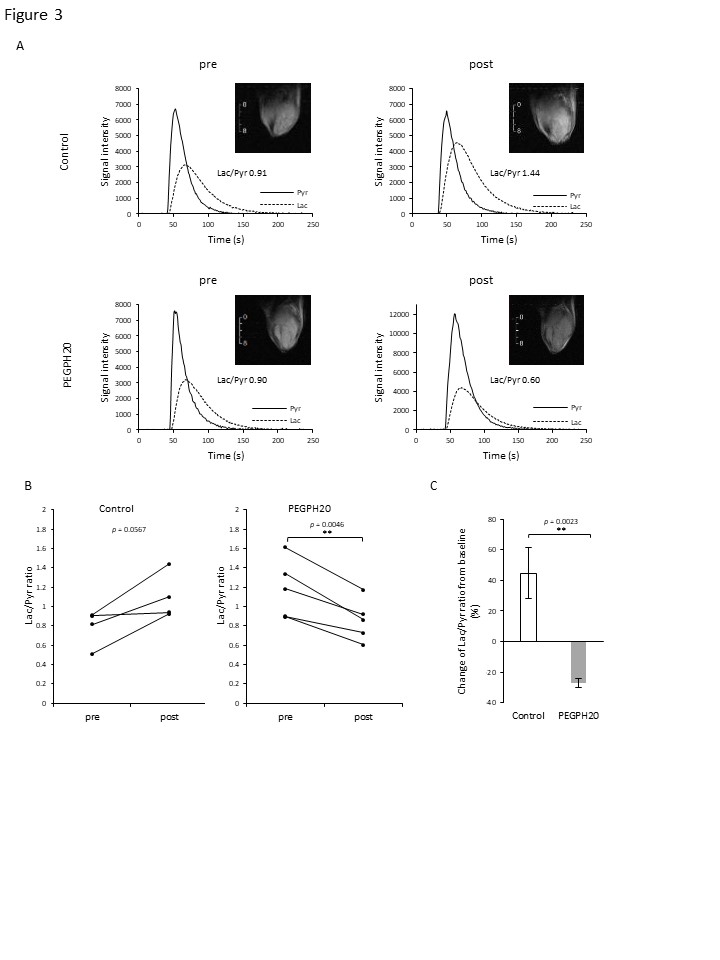
Fig. 3 HP [1-13C] Pyruvate MRI showed decreased Lac/Pyr ratio after PEGPH20 treatment.
HP [1-13C] Pyruvate MRI was performed in BxPC3-HAS3 tumor bearing mice treated with control buffer or PEGPH20 before and after treatment. A, Representative kinetics of [1-13C] pyruvate and [1-13C] lactate and its anatomical 1H image. B, Lac/Pyr ratio of each tumor are shown by treatment group. Individual values are shown. C, Lac/Pyr ratio change from the baseline (pre-treatment) of each group.

Fig. 1 EPR imaging showed increased pO2 after PEGPH20 treatment.
EPR imaging was performed in BxPC3-HAS3 tumor bearing mice treated with control buffer or PEGPH20 before and after treatment. A, Representative oxygen map obtained by EPR imaging and T2-weighted anatomical image. B, Histograms of pO2 distribution within the tumor of each group. C, The mean pO2 of each tumor shown by treatment group. D, pO2 change (%) from the baseline (pre-treatment) of each group.