Qingqing Wen1, Kang Wang2, Yi-Cheng Hsu3, Yan Xu4, Yi Sun3, Dan Wu1,2, and Yi Zhang1,2
1Key Laboratory for Biomedical Engineering of Ministry of Education, Department of Biomedical Engineering, College of Biomedical Engineering & Instrument Science, Zhejiang University, Hangzhou, China, 2Department of Neurology, First Affiliated Hospital, College of Medicine, Zhejiang University, Hangzhou, China, 3MR Collaboration, Siemens Healthcare Ltd., Shanghai, China, 4Department of Neurosurgery, Zhejiang Provincial People's Hospital, HangZhou, China
1Key Laboratory for Biomedical Engineering of Ministry of Education, Department of Biomedical Engineering, College of Biomedical Engineering & Instrument Science, Zhejiang University, Hangzhou, China, 2Department of Neurology, First Affiliated Hospital, College of Medicine, Zhejiang University, Hangzhou, China, 3MR Collaboration, Siemens Healthcare Ltd., Shanghai, China, 4Department of Neurosurgery, Zhejiang Provincial People's Hospital, HangZhou, China
A 2-stage simulation
method was proposed to assess the metabolite contribution to the CEST contrast
between disease and normal tissues, which may provide a route for investigating
the change of molecular content in pathologies compared with normal tissues.
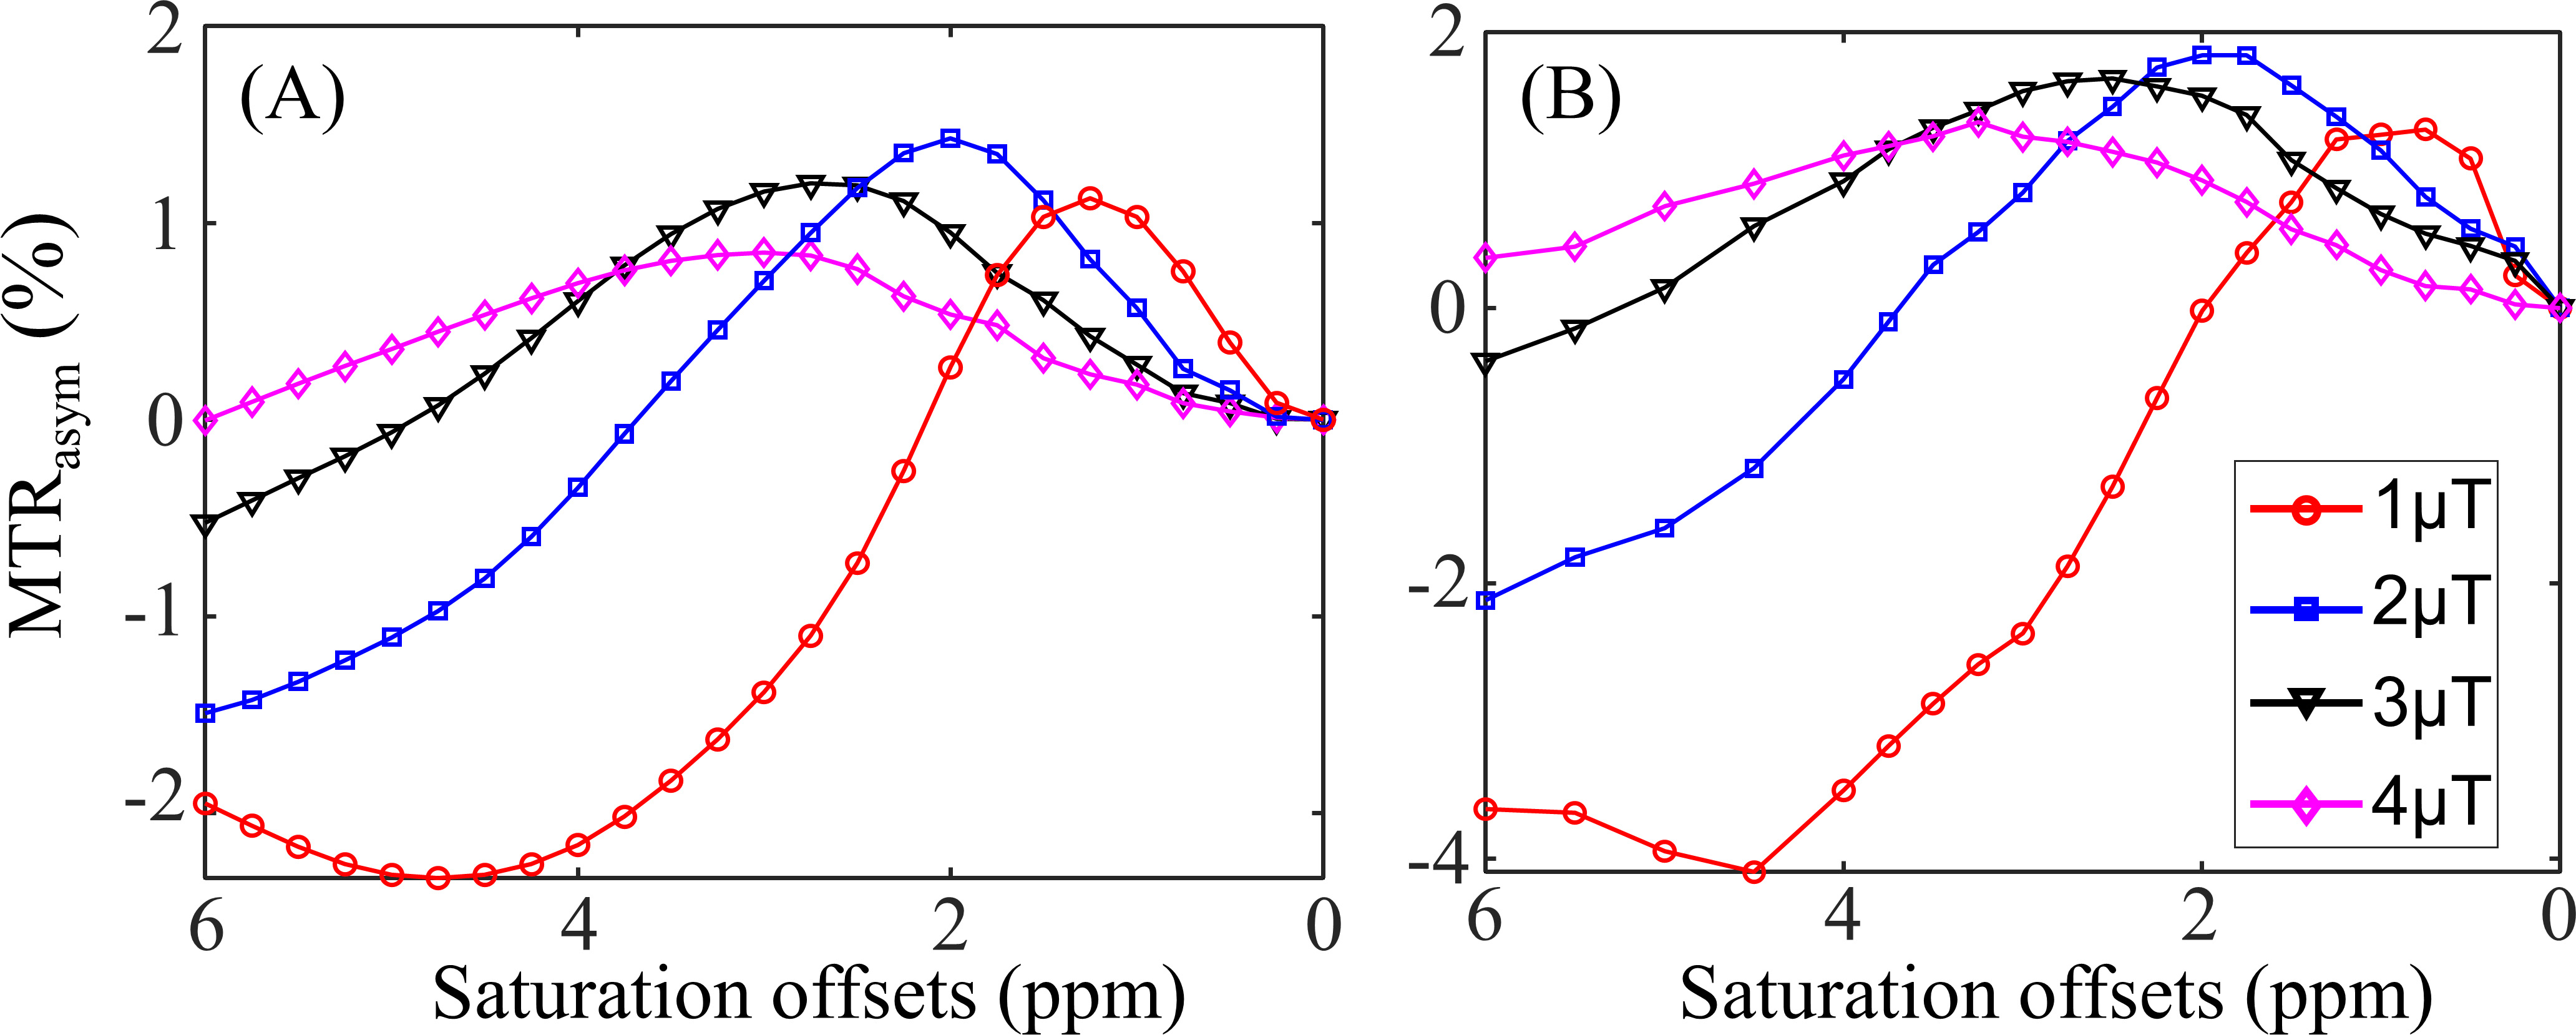
Figure 2. Simulated (A) and
experimental (B) MTRasym curves in the normal brain tissues for B1
values of 1, 2, 3, and 4μT. The experimental curves (B) represented the mean MTRasym
spectra of the normal brain tissues in 9 TSC patients.
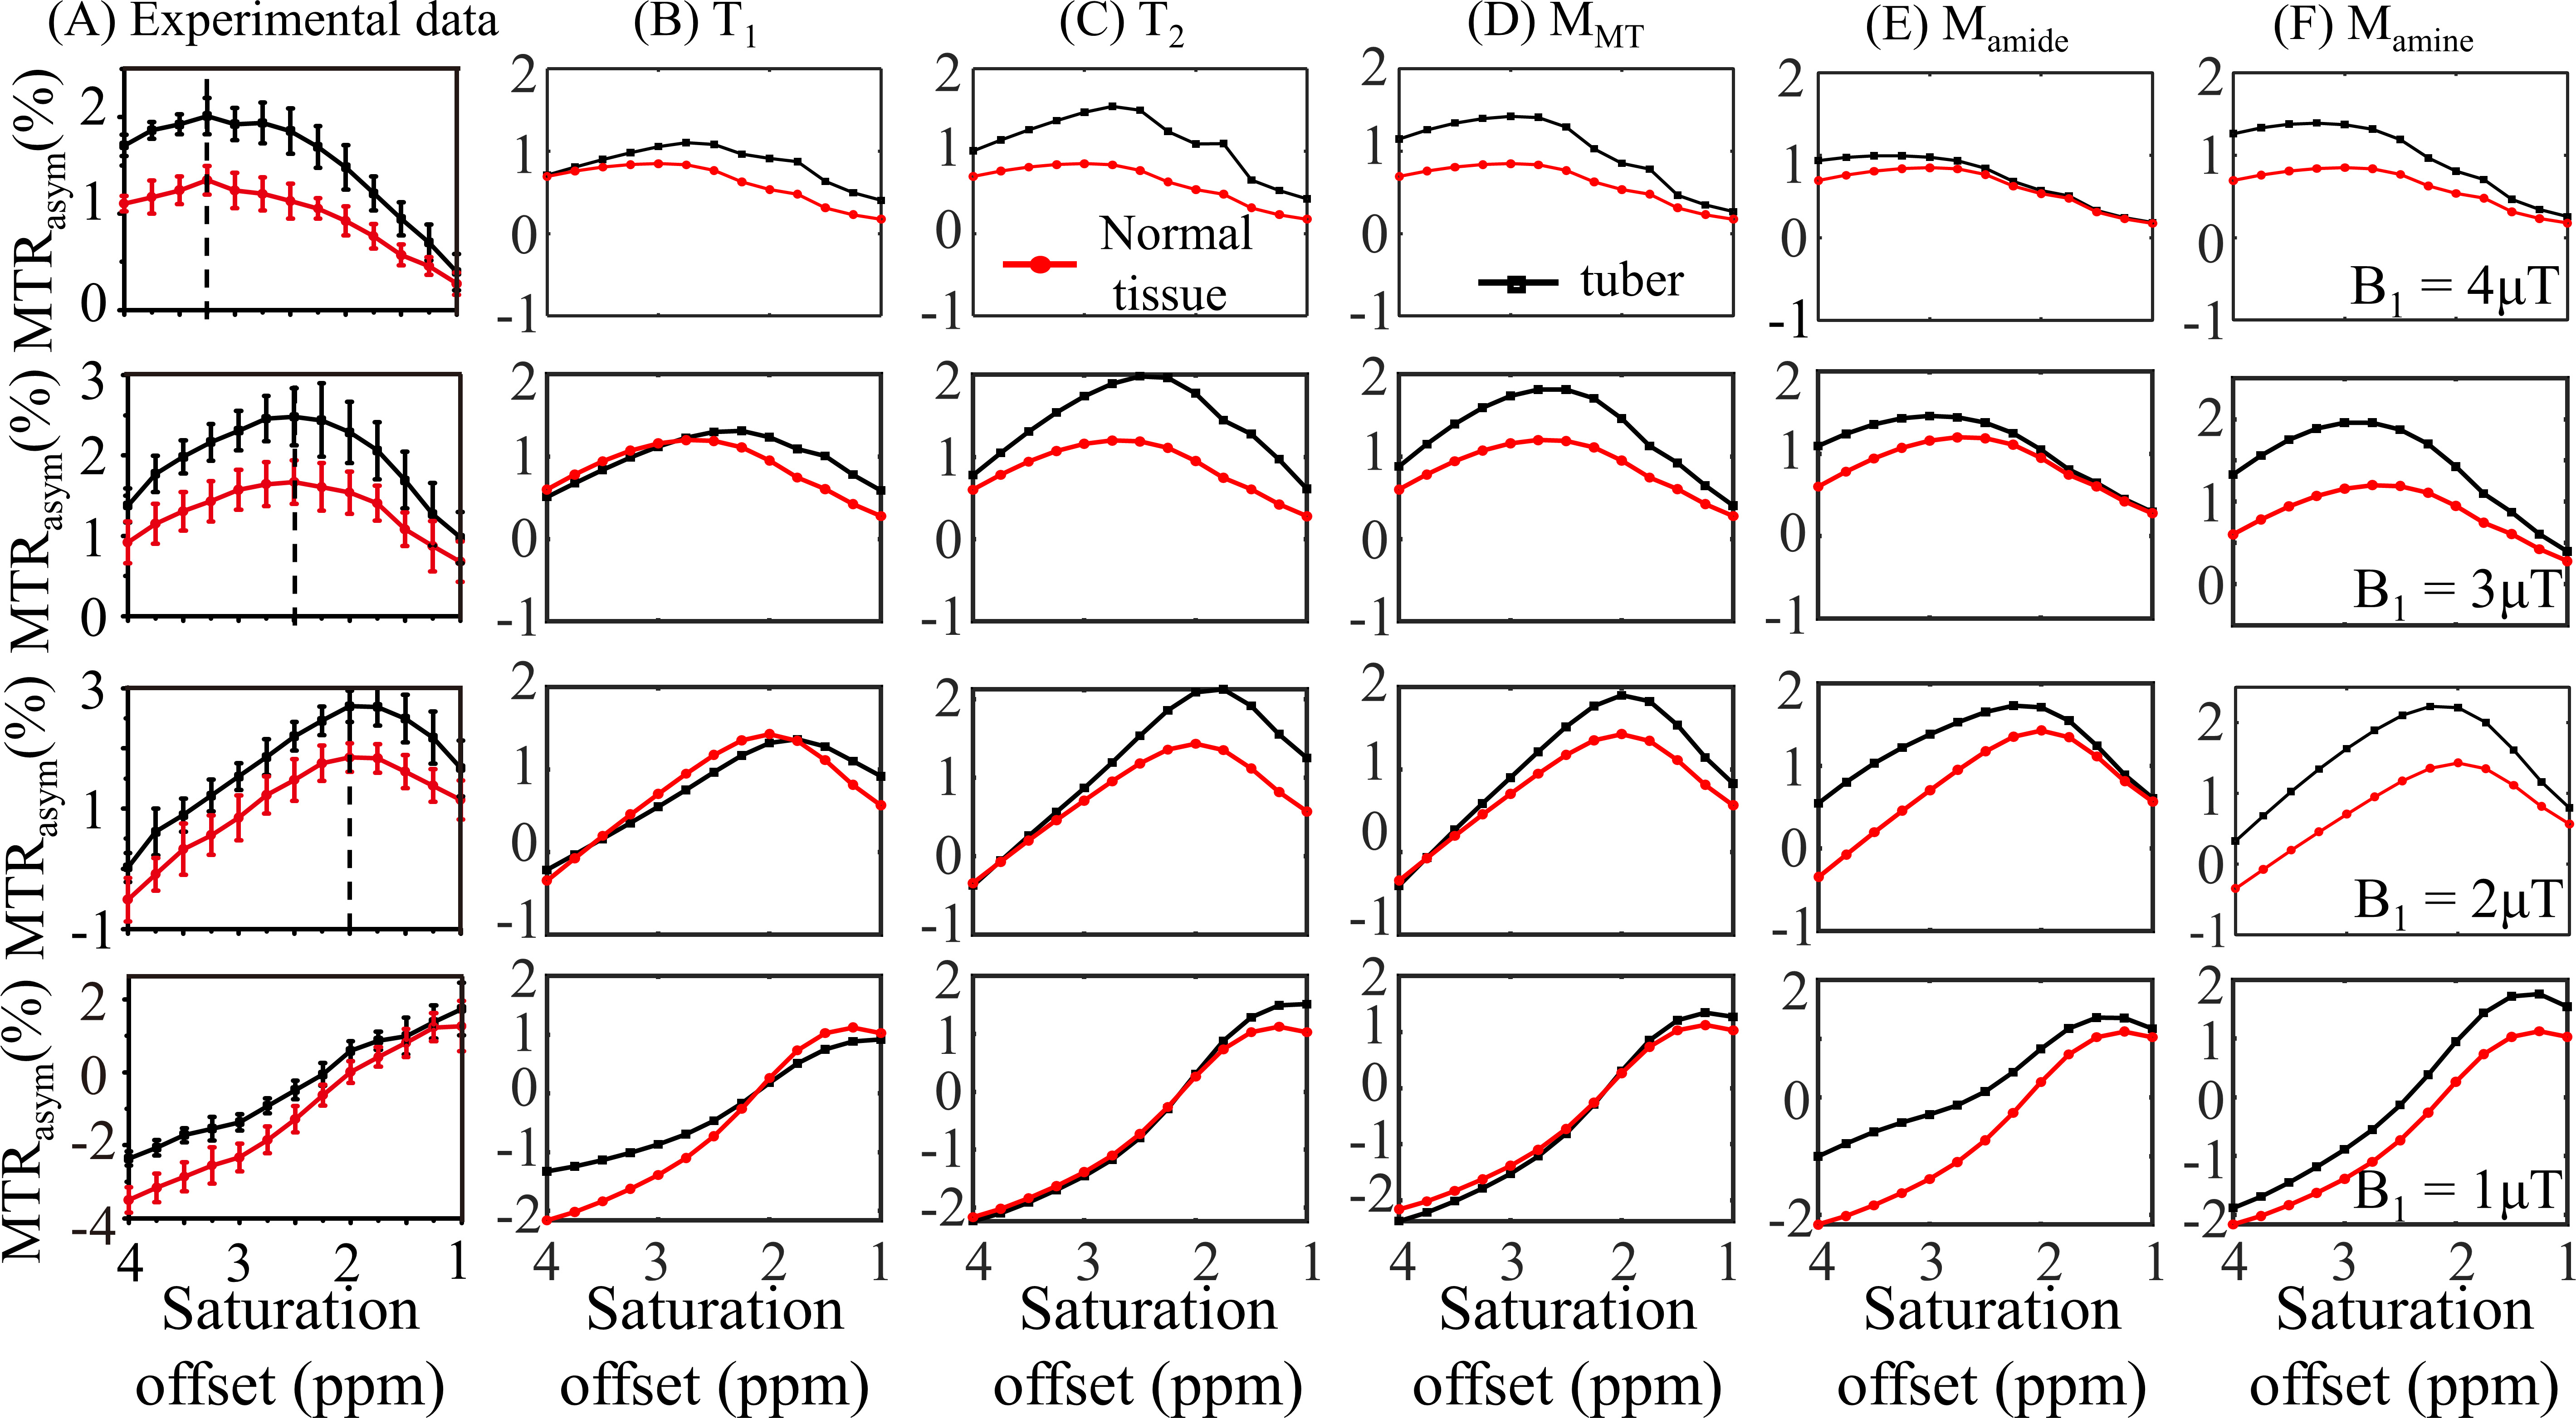
Figure 3. Comparison of
experimental (A) and simulated (B-F) MTRasym spectra with the
proposed 2-stage method at four B1 levels. The MTRasym curves in normal
tissues (red lines) were simulated with the parameters listed in Table 1. As
for the MTRasym spectra in cortical tubers (black lines), they were
obtained via varying T1 (part B), T2 (part C), MMT
(part D), Mamide (part E), and Mamine (part F) according
to Table 2B, in order to generate the mRMSE between simulated and experimental
CEST contrast for each of the candidate Bloch-McConnell parameters.