Maxime Chamberland1, Dmitri Shastin1,2, Sila Genc1, Khalid Hamandi1,3, William P. Gray1,2, Chantal M.W Tax1, and Derek K. Jones1
1Cardiff University Brain Research Imaging Centre (CUBRIC), Cardiff University, Cardiff, United Kingdom, 2Department of Neurosurgery, University Hospital Wales, Cardiff, United Kingdom, 3Department of Neurology, University Hospital of Wales, Cardiff, United Kingdom
1Cardiff University Brain Research Imaging Centre (CUBRIC), Cardiff University, Cardiff, United Kingdom, 2Department of Neurosurgery, University Hospital Wales, Cardiff, United Kingdom, 3Department of Neurology, University Hospital of Wales, Cardiff, United Kingdom
We present a microstructure-informed anomaly detection framework to shift from traditional group-based comparisons to true personalised-radiology in epilepsy. Using a normative modelling approach, deep white matter anomalies were identified in patients with focal cortical dysplasia.

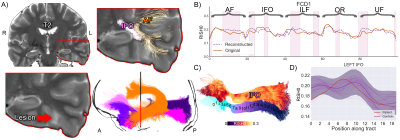
S1 overview. A) T2 hyperintense lesion
located at the base of the skull in the temporal lobe. Several pathways with
anomalies interdigitate in the vicinity of the lesion. The shaded area (bottom
right) shows the mean population profile (bold purple line, shaded area = +/-1
z-score). Although the IFO signal did not extend beyond the shaded area (C, D),
the proposed anomaly detection framework identified abnormalities in that
region (B, pink areas). Bold orange line: original tract-profiles. Dotted
purple line: reconstructed representation learned from the network.

S2 overview. A) The lesion is located anterior
to the right primary motor cortex in the supplementary motor area (hyperintense signal on the FLAIR image, hypointense on the RISH map). Tractography show tracts traversing the area (CC4). B) Anomalies
were identified in the right CC4, CST, and SLF-I bundles (top right, pink areas).
The bold orange line represents the original tract-profiles whereas the dotted
purple line represents the reconstructed representation learned from the
network. The z-score approach shows less focused anomaly patterns along
the tracts (shaded area: +/- 1 Z).
