Qihao Zhang1, Michele B Drotman1, Christine Chen1, Thanh Nguyen1, Pascal Spincemaille1, and Yi Wang2
1Weill Cornell Medical College, New York, NY, United States, 2Cornell University, New York, NY, United States
1Weill Cornell Medical College, New York, NY, United States, 2Cornell University, New York, NY, United States
For postprocessing dynamic contrast enhanced MRI, automated quantitative
transport mapping based on inverting the transport equation is more accurate
than traditional Kety’s method and enhancement curve characteristics for
differentiating benign from malignant tumors in the breast.

Figure 2. Comparison of QTM
method and Kety’s method on a malignant lesion. This is a 73 years old patient
with biopsy proven malignant lesion. a) post-Gd T1 weighted image, b) QTM |u| map, c) Ktrans and d) Ve map using internal mammary (IM) AIF.
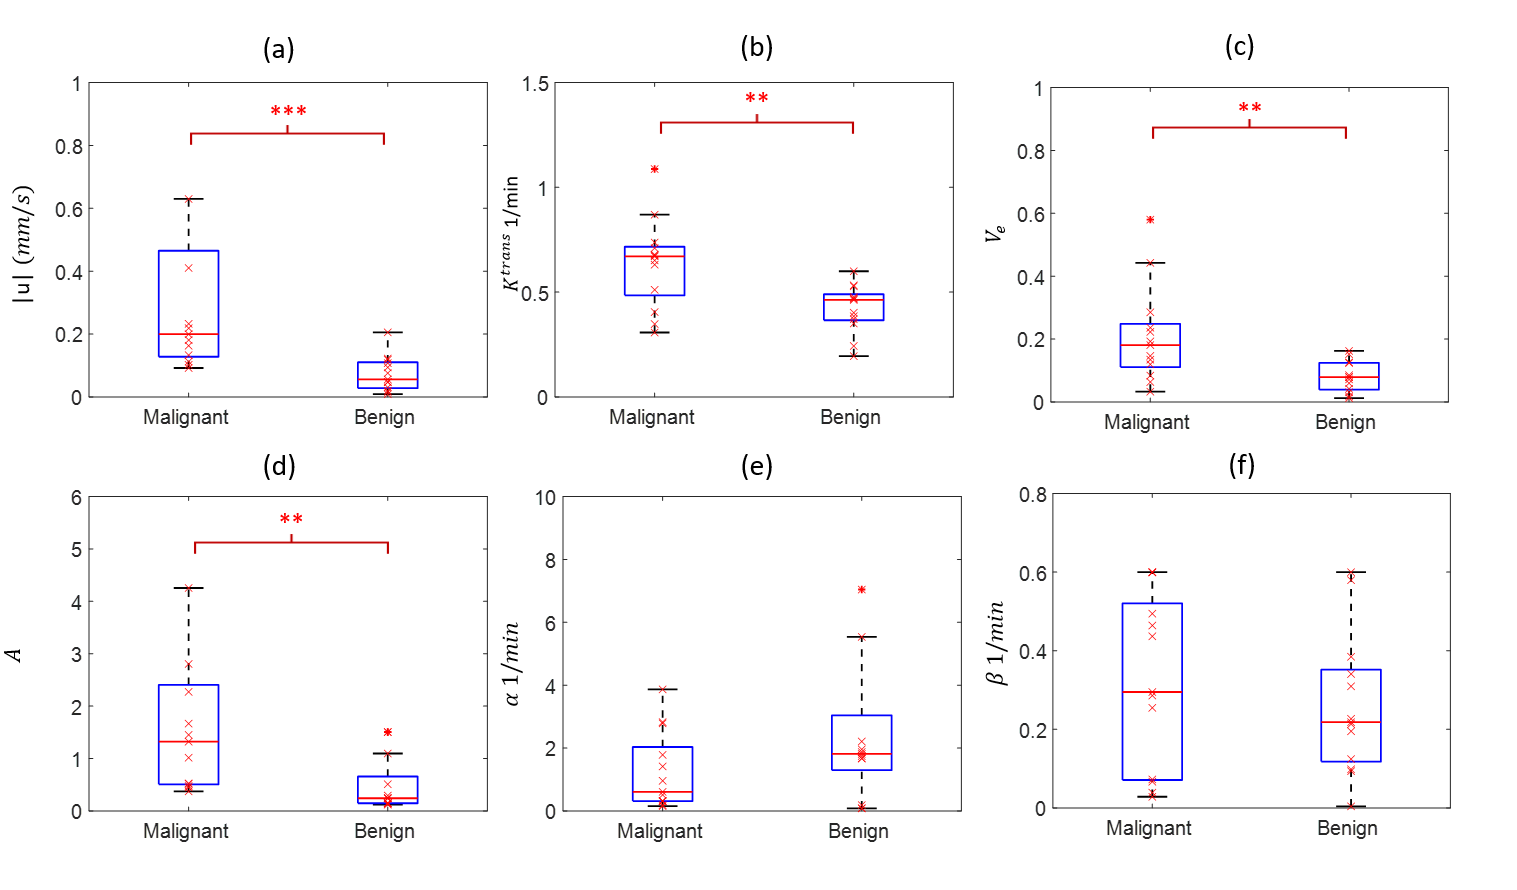
Figure 3. Differentiating
malignant breast lesions from benign breast lesions. a) QTM |u| (p<0.001), b) Ktrans (p=0.007), c) Ve (p=0.006) and d) A (p=0.001) demonstrating
significance difference between malignant and benign lesions. There were no
other parameters demonstrating significant difference between malignant and
benign lesions.