1Department of Radiology, University Medical Center Utrecht, Utrecht, Netherlands

Figure 1. 3D DMI measurements at baseline and 0-130 min after oral administration of [6,6’-2H2]glucose (scan 1). (A) Overlay of last DMI data set (130 min) on transversal Dixon water image, with equal scaling of all spectra. (B-D) DMI spectra at baseline and up to 130 min after intake of deuterated glucose from voxels in the anterior (B) and posterior (C) side of the liver and the stomach (D).
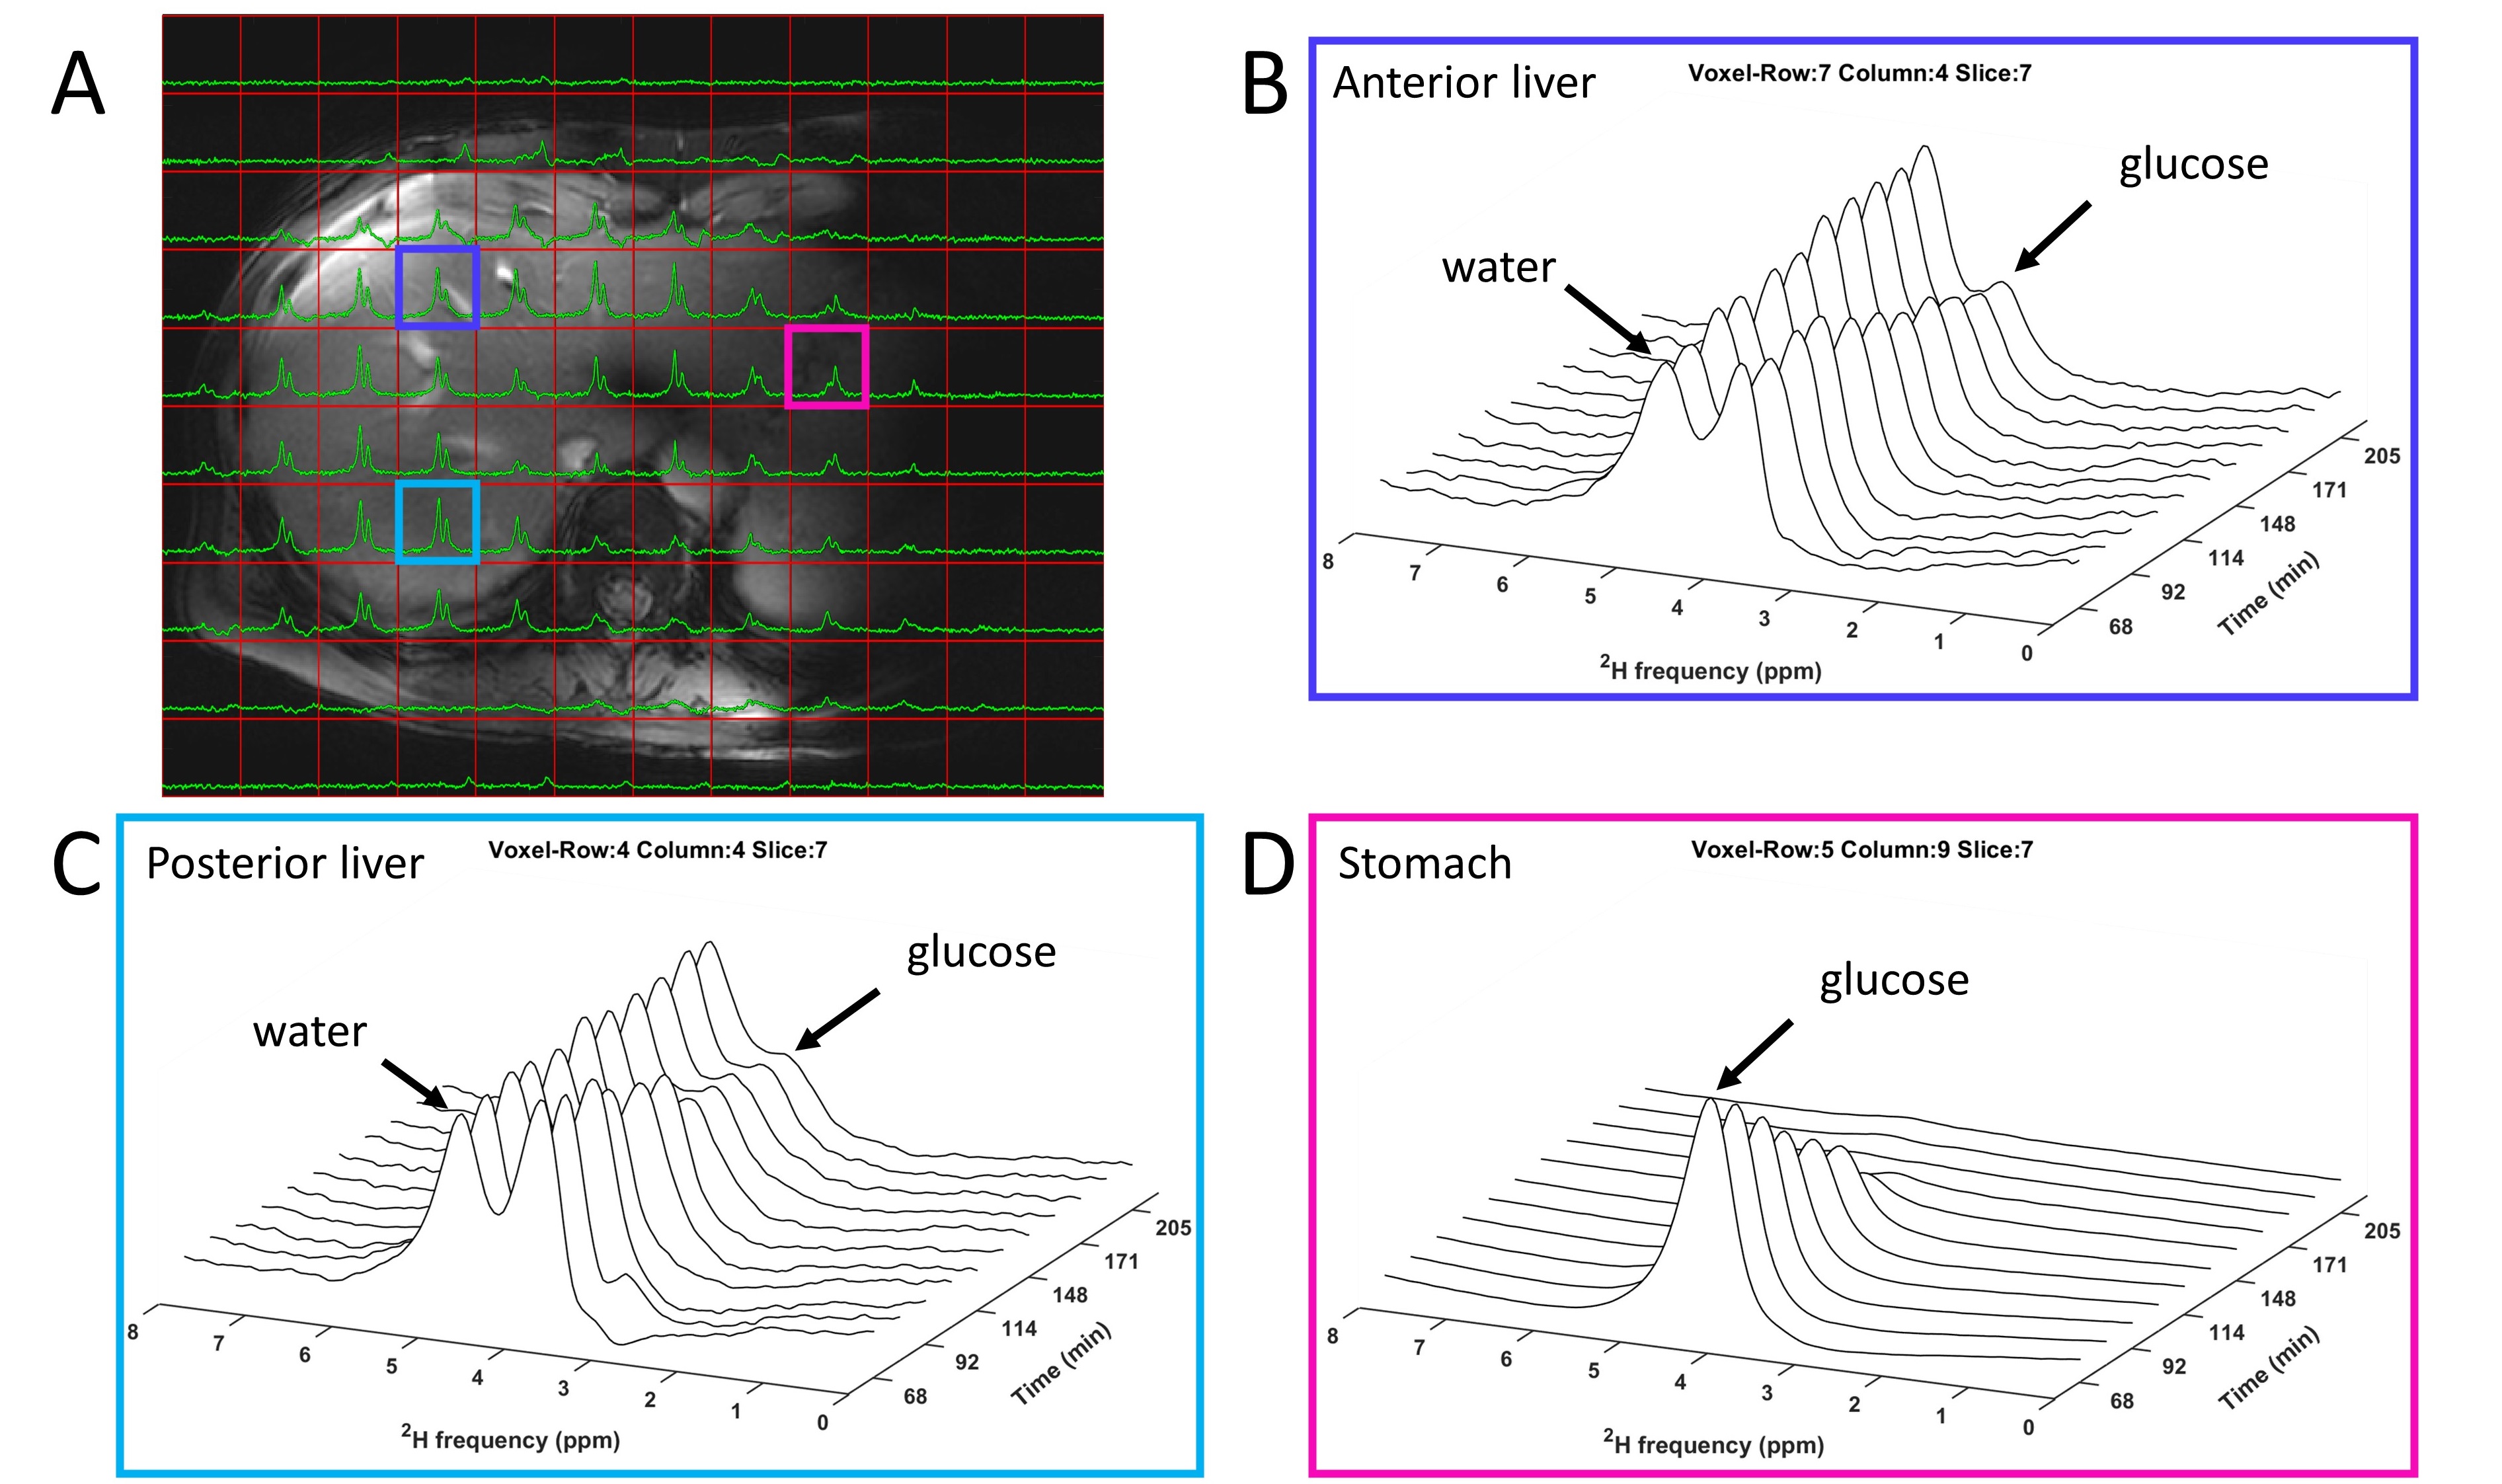
Figure 3. 3D DMI measurements 68-205 min after oral administration of [6,6’-2H2]glucose (scan 2). (A) Overlay of a DMI data set (160 min after intake) on transversal Dixon water image, with equal scaling of all spectra. (B-D) DMI spectra recorded from 68-205 min after intake of deuterated glucose from voxels in the anterior (B) and posterior (C) side of the liver and the stomach (D).
