Samy Abo Seada1, Emanoel Ribeiro Sabidussi1, Sebastian Weingärtner2, Dirk H. J. Poot1, and Juan Antonio Hernandez-Tamames1
1Department of Radiology and Nuclear Medicine, Erasmus MC, Rotterdam, Netherlands, 2Department of Imaging Physics, TU Delft, Delft, Netherlands
1Department of Radiology and Nuclear Medicine, Erasmus MC, Rotterdam, Netherlands, 2Department of Imaging Physics, TU Delft, Delft, Netherlands
The
RIM learned the dipole inversion problem and preserved the intensity
distribution of the unseen input data. MEDI outperformed RIM in
error metrics and on
the in-vivo dataset, suggesting training was incomplete.
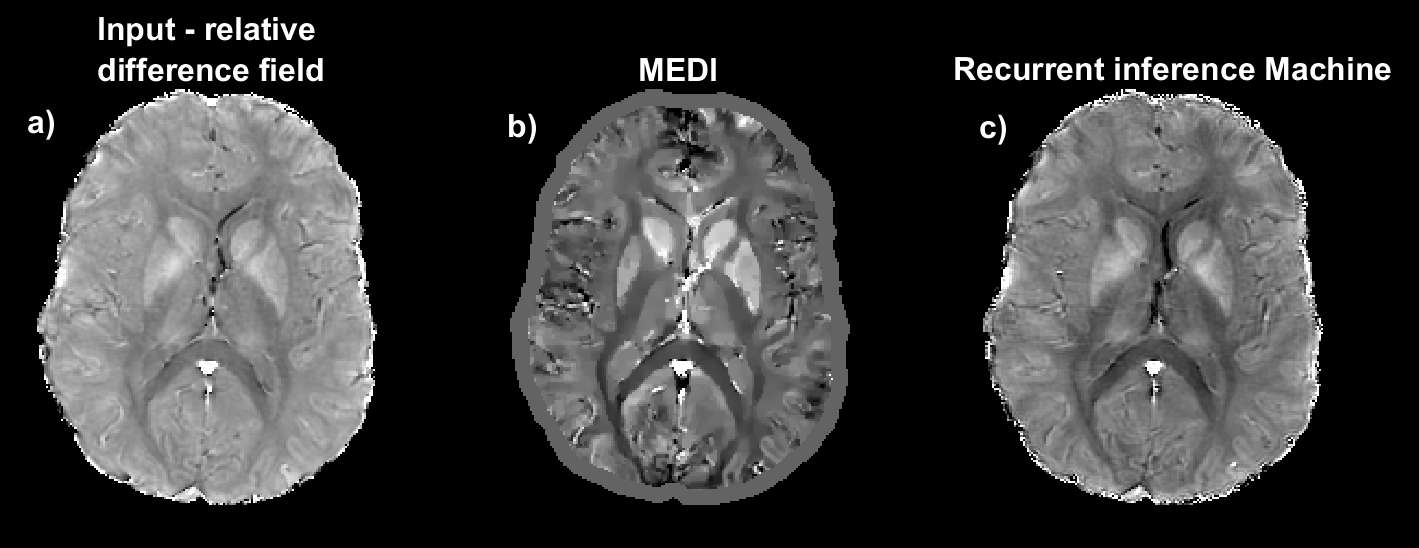
Figure 5 - In-vivo results acquired at 3T showing the a) preprocessed input image, used as a starting point for both b) MEDI and the c) Recurrent Inference
Machine (RIM). The MEDI results shows high contrast
in the deep nuclei regions associated with higher iron content. However,
the image gets smoothed by the spherical filter. The
RIM result has some element from the MEDI image such as dark contrast in the
myelin regions, yet remains similar to the input image to a large extent.
Possibly, the network did not complete training, or the training data was
unsuited to this problem.

Figure 2 - The RIM inference process for an axial example drawn
from the testing data, along with each estimate from the iterative MEDI
procedure. The label (ground truth) and input signal are shown in the left-most
column. In both techniques the shapes become clearly defined with increasing
iterations, as expected. The initial inference from RIM resolve many shapes,
but with an incorrect susceptibility range (e.g. sphere, middle-left) which
does not get corrected over inferences. MEDI on the other hand converges closer
to the label data.
