Wei-Hao Huang1, Chia-Ming Shih1, Po-Wei Cheng1, and Jyh-Horng Chen1,2
1Graduate Institute of Biomedical Electronics and Bioinformatics, National Taiwan University, Taipei, Taiwan, Taipei, Taiwan, 2Interdisciplinary MRI/MRS Lab, Department of Electrical Engineering, National Taiwan University, Taipei, Taiwan, Taipei, Taiwan
1Graduate Institute of Biomedical Electronics and Bioinformatics, National Taiwan University, Taipei, Taiwan, Taipei, Taiwan, 2Interdisciplinary MRI/MRS Lab, Department of Electrical Engineering, National Taiwan University, Taipei, Taiwan, Taipei, Taiwan
In this study, we aim to combine dynamic contrast enhanced magnetic resonance imaging (DCE-MRI) and Wideband technique to improve temporal resolution. We compare the quantitative results to the conventional DCE and validate the feasibility of high temporal resolution Wideband DCE.
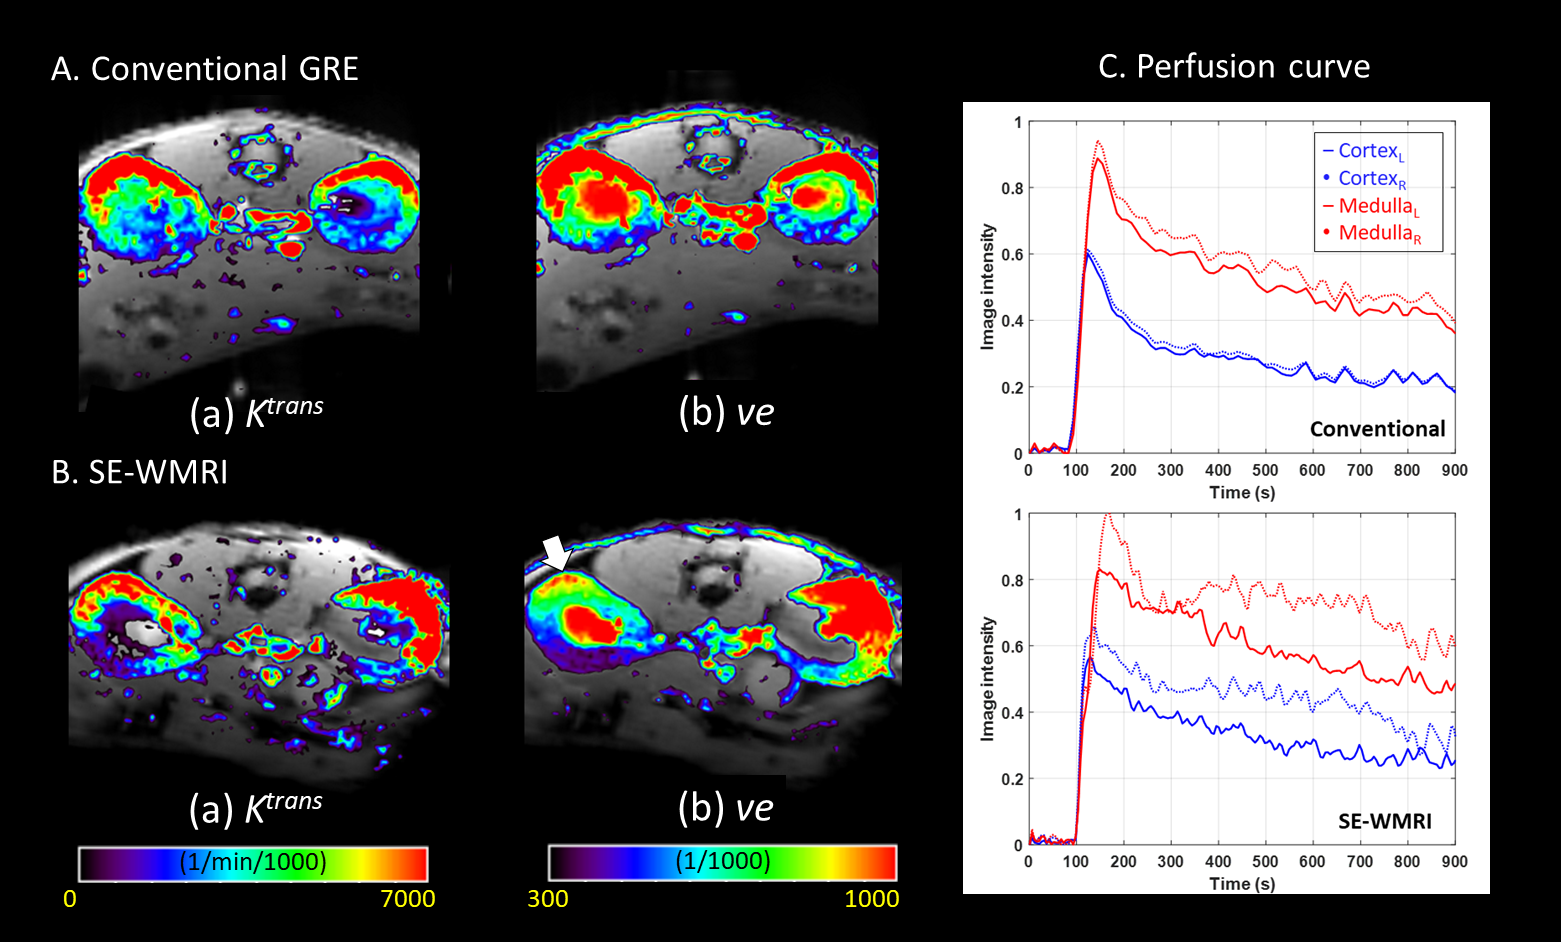
Figure2.
(A)(B) represent the result of conventional GRE and SE-WMRI respectively. In Ktrans maps, the cortex
region has higher values. (Ktrans
are 5544 and 5760 (1/min/1000) in conventional GRE and SE-WMRI.). In ve maps, the medulla area has high ve which is around 900 (1/1000)
(Conventional GRE: 929, SE-WMRI:898 (1/1000)) but it is lower in the white
arrow area. (C) shows the multi-region perfusion curves. The SE-WMRI curves are
inconsistent because of physiological differences which also correspond to quantitative analysis.
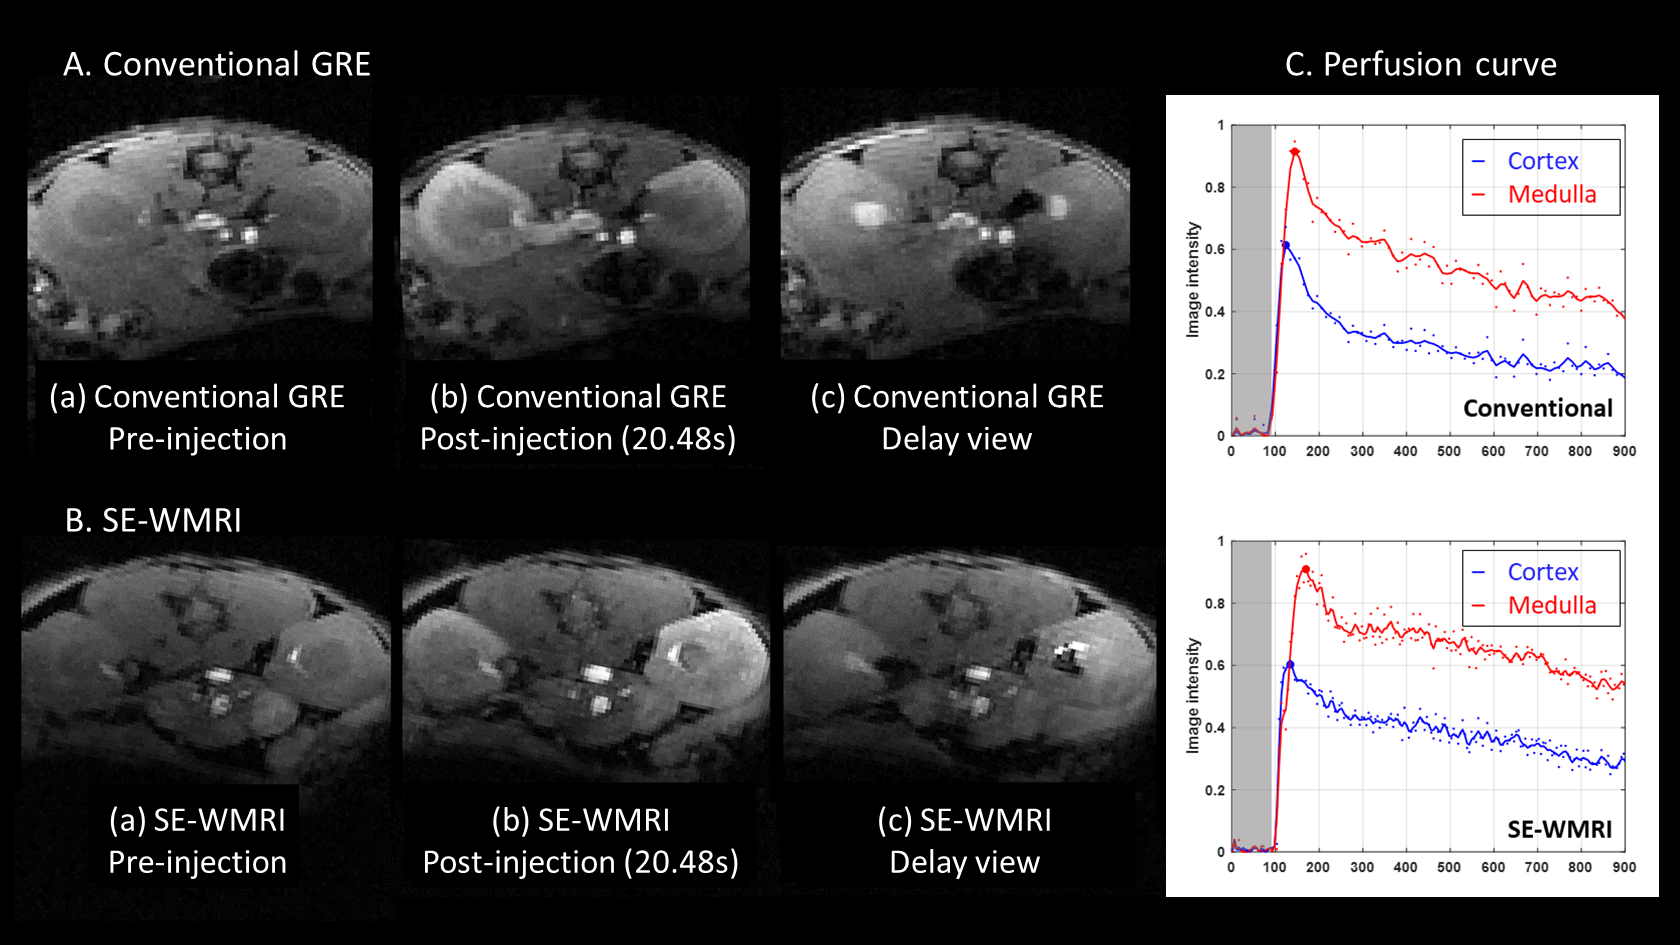
Figure1.
(A) demonstrates the three different stages of image result of conventional GRE.
Same as (A), (B) show the image result of SE-WMRI. (C) presents the perfusion
curves of conventional GRE and SE-WMRI. The image intensity is normalized to
the pre-injection image intensity and apply the Gaussian low-pass filter to
relieve the effect caused by motion. The blue line and red line represent the
cortex and medulla region and the dots are the original data. The time delay of
intensity peaks between the cortex and the medulla is 20.24s in conventional
GRE, 30.72s in SE-WMRI.