Tamas Borbath1,2, Saipavitra Murali-Manohar1,2, Johanna Dorst1,3, Andrew Martin Wright1,3, and Anke Henning1,4
1High-field Magnetic Resonance, Max Planck Institute for biological Cybernetics, Tübingen, Germany, 2Faculty of Science, University of Tübingen, Tübingen, Germany, 3IMPRS for Cognitive & Systems Neuroscience, Tübingen, Germany, 4Advanced Imaging Research Center, UT Southwestern Medical Center, Dallas, TX, United States
1High-field Magnetic Resonance, Max Planck Institute for biological Cybernetics, Tübingen, Germany, 2Faculty of Science, University of Tübingen, Tübingen, Germany, 3IMPRS for Cognitive & Systems Neuroscience, Tübingen, Germany, 4Advanced Imaging Research Center, UT Southwestern Medical Center, Dallas, TX, United States
The newly developed ProFit-v3
fitting algorithm, including an adaptive baseline stiffness control and a new
cost function, was evaluated for accuracy and precision using both simulated
and in vivo spectra. Fitted metabolite concentration results were also compared
against LCModel.

Fig. 2: Fit results for the baseline
simulations are shown. The blue line shows the
input spectrum; the black line the input baseline. Fitted baselines (dashed
lines) and resulting residuals (continuous lines) are shown in red for LCModel
and purple for ProFit-v3. Offsets used for plotting are indicated on the right
of each subplot. Inlays show the mAIC
curves for the ProFit-v3 fitting. These spectra show
a simulated zero baseline, an in-phase (φ0 = 0°) and an out
of phase (φ0 = 90°) lipid peak at 1.3 ppm, but also an extracted
baseline from a previous LCModel fit of an in vivo spectrum.

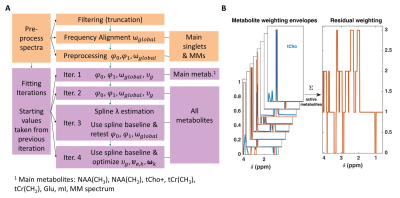
Fig. 1 A:
The ProFit-v3 algorithm is depicted with the successive optimization steps:
first preprocessing steps affect the spectrum to be fit while the fitting
iterations optimize the linear combination of the basis sets. In later
iterations, more metabolites are added, and additional metabolite specific local
degrees of freedom are allowed while keeping the previously optimized global
parameters. B: Metabolite weighting
envelopes are displayed in red. Summing the weights of active metabolites for
the fit iteration gives the weights of the spectral residual RX shown on the right.
