Bradley Karat1, Jordan DeKraker1, Uzair Hussain2, and Ali Khan1,2
1Department of Neuroscience, Schulich School of Medicine & Dentistry, Western University, London, ON, Canada, 2Centre for Functional and Metabolic Mapping, Robarts Research Institute, Western University, London, ON, Canada
1Department of Neuroscience, Schulich School of Medicine & Dentistry, Western University, London, ON, Canada, 2Centre for Functional and Metabolic Mapping, Robarts Research Institute, Western University, London, ON, Canada
Current measures of hippocampal microstructure tend to be non-specific within subfields. Measures along the principal axes of the hippocampus that respect the orientation of fibre pathways and neurites were found to be significantly correlated with local microstructure.
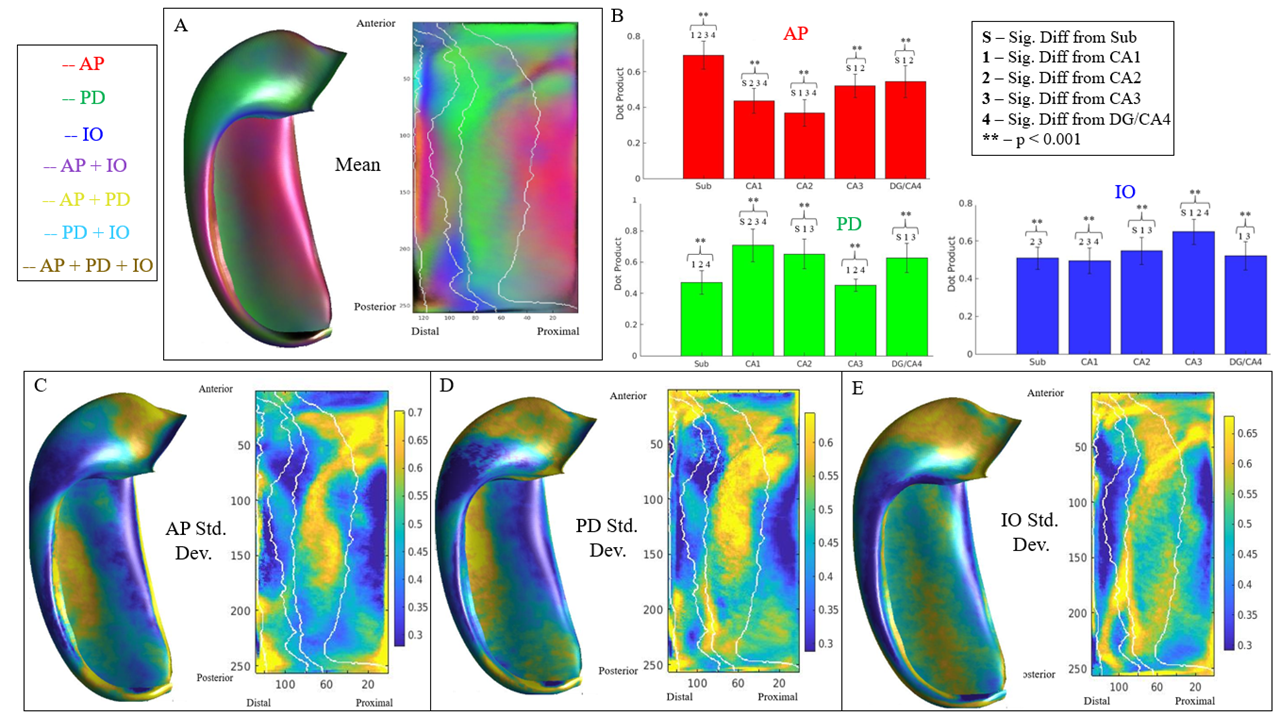
Figure 3. Mean
and standard deviation of dot product across each gradient direction. (A) Same
plot as in figure 2. Depicting mean dot product by gradient direction across
all participants and hippocampi (N = 192). (B) Mean dot product within each
gradient direction across each subfield. Error bars represent one standard
deviation. One-way ANOVA and Tukey’s post hoc test revealed significant
differences of mean dot product between subfields within gradient direction.
Legend depicts significant correlations. (C-E) Standard deviation of dot
product for each gradient direction.
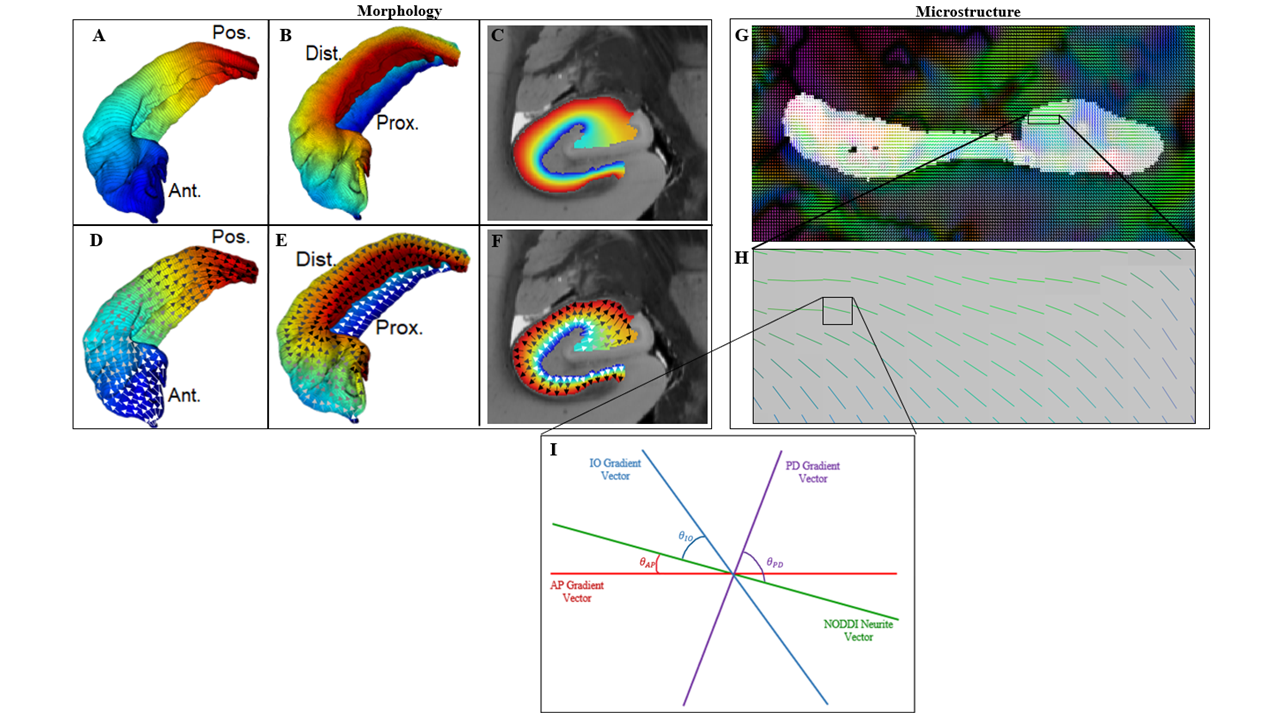
Figure 1. Hippocampal
morphology and microstructure. (A-C) Laplacian potential fields in
anterior-posterior, proximal distal, and inner-outer dimensions. (C) Coronal
slice. (D-F) Gradient vectors from first derivation of potential field in
(A-C). (G) Sagittal slice - NODDI neurite vectors on a hippocampal mask. (H)
Rectangle in (G) – zoom of NODDI neurite vectors. (I) Square in (H) representing one voxel and
one neurite vector. Red, purple, and blue lines depict gradient vectors at that
voxel for anterior-posterior, proximal-distal, and inner-outer, respectively.