Deep B. Gandhi1, Amol Pednekar1, Hui Wang2, Jean A. Tkach1, Andrew T. Trout1, and Jonathan R. Dillman1
1Imaging Research Center, Department of Radiology, Cincinnati Children's Hospital Medical Center, Cincinnati, OH, United States, 2MR Clinical Science, Philips, Cincinnati, OH, United States
1Imaging Research Center, Department of Radiology, Cincinnati Children's Hospital Medical Center, Cincinnati, OH, United States, 2MR Clinical Science, Philips, Cincinnati, OH, United States
Whole liver T1 quantification in a single breath-hold using
3D-QALAS correlates very strongly (r=0.95) with 2D-MOLLI, but underestimates T1 significantly (p<0.0001) with a bias of 92.5 ms (14.2%).
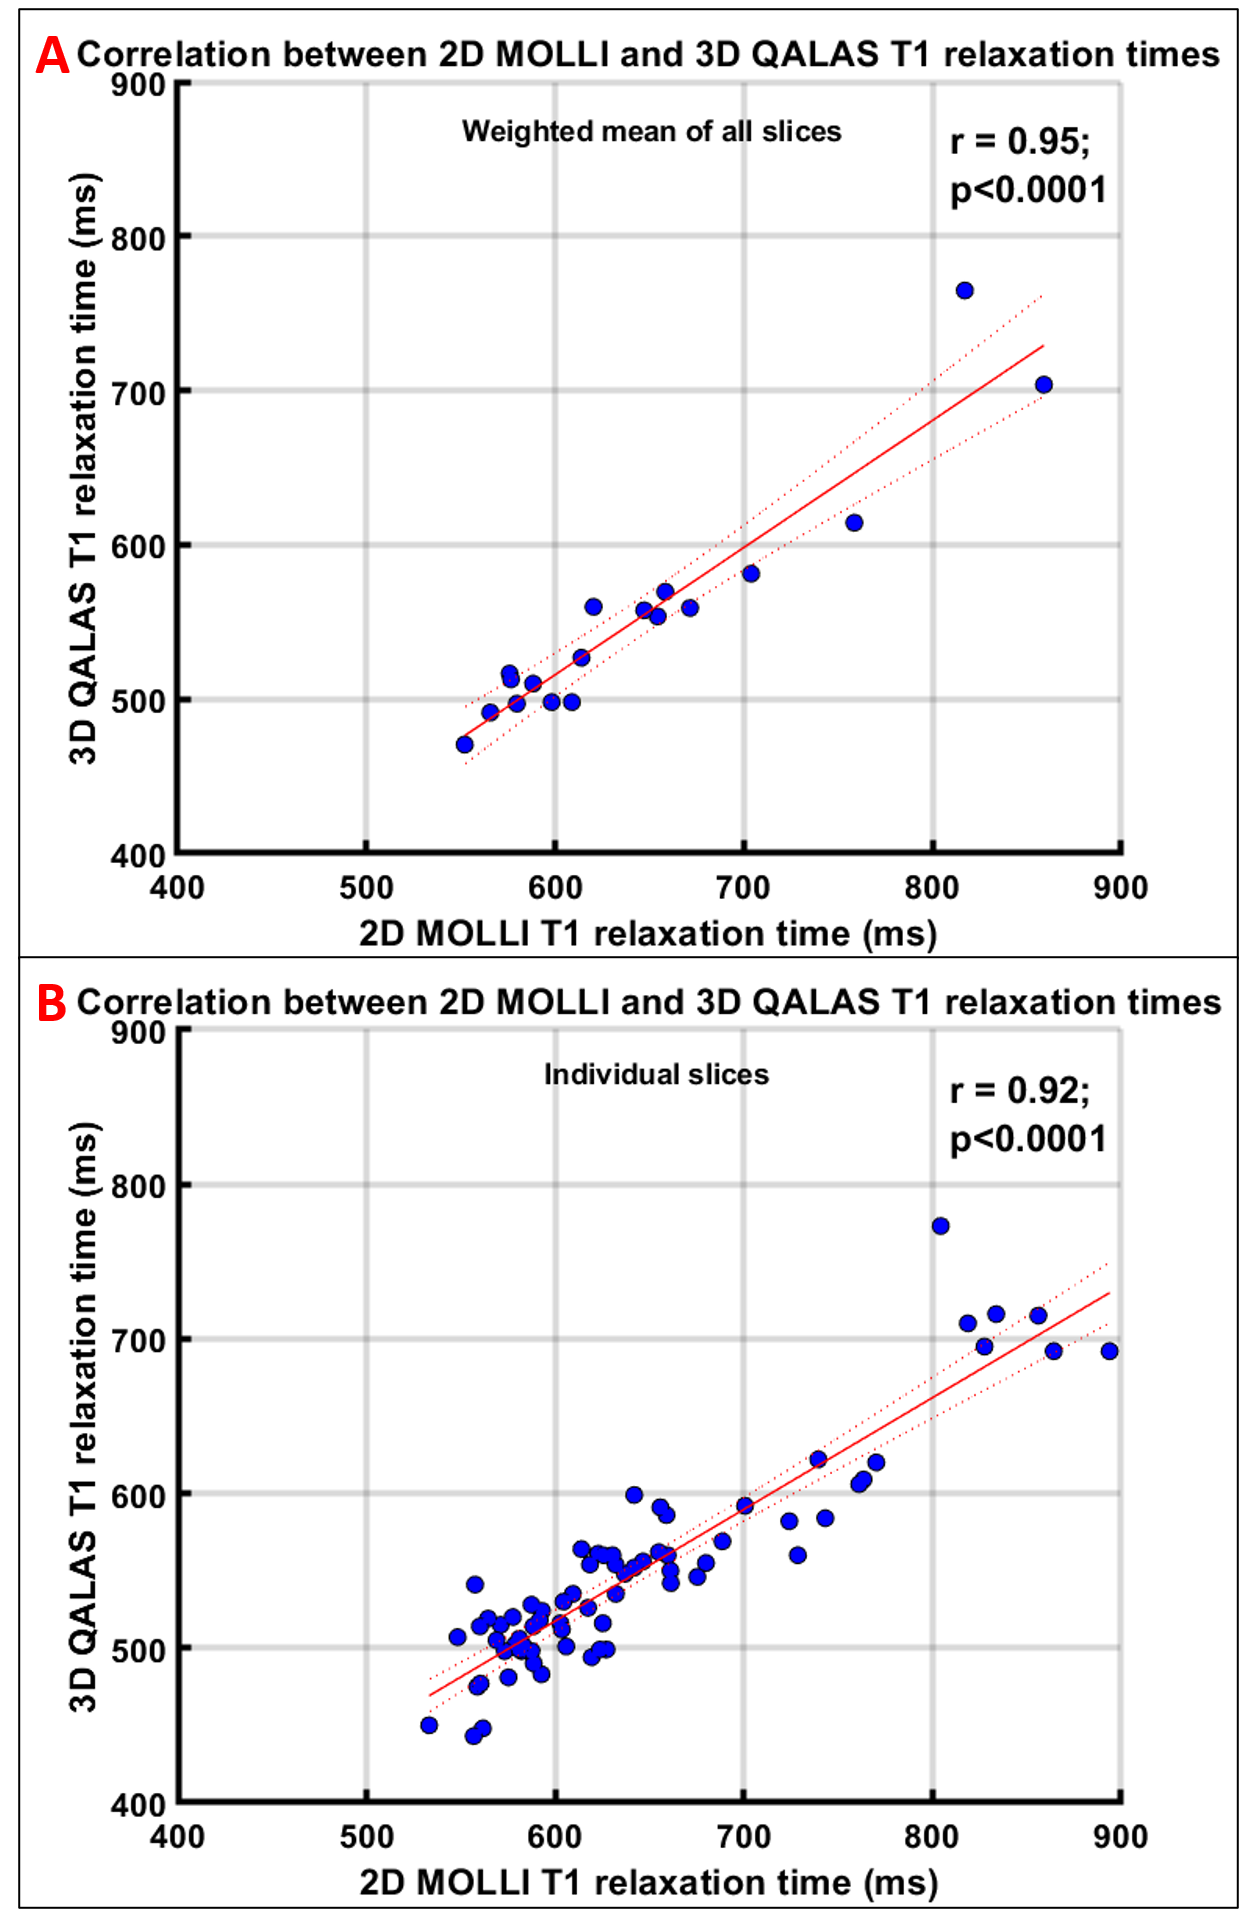
Figure 1. Correlation plots of T1 hepatic values
using 2D-MOLLI versus 3D-QALAS (A) mean T1 and (B) T1 of individual slices
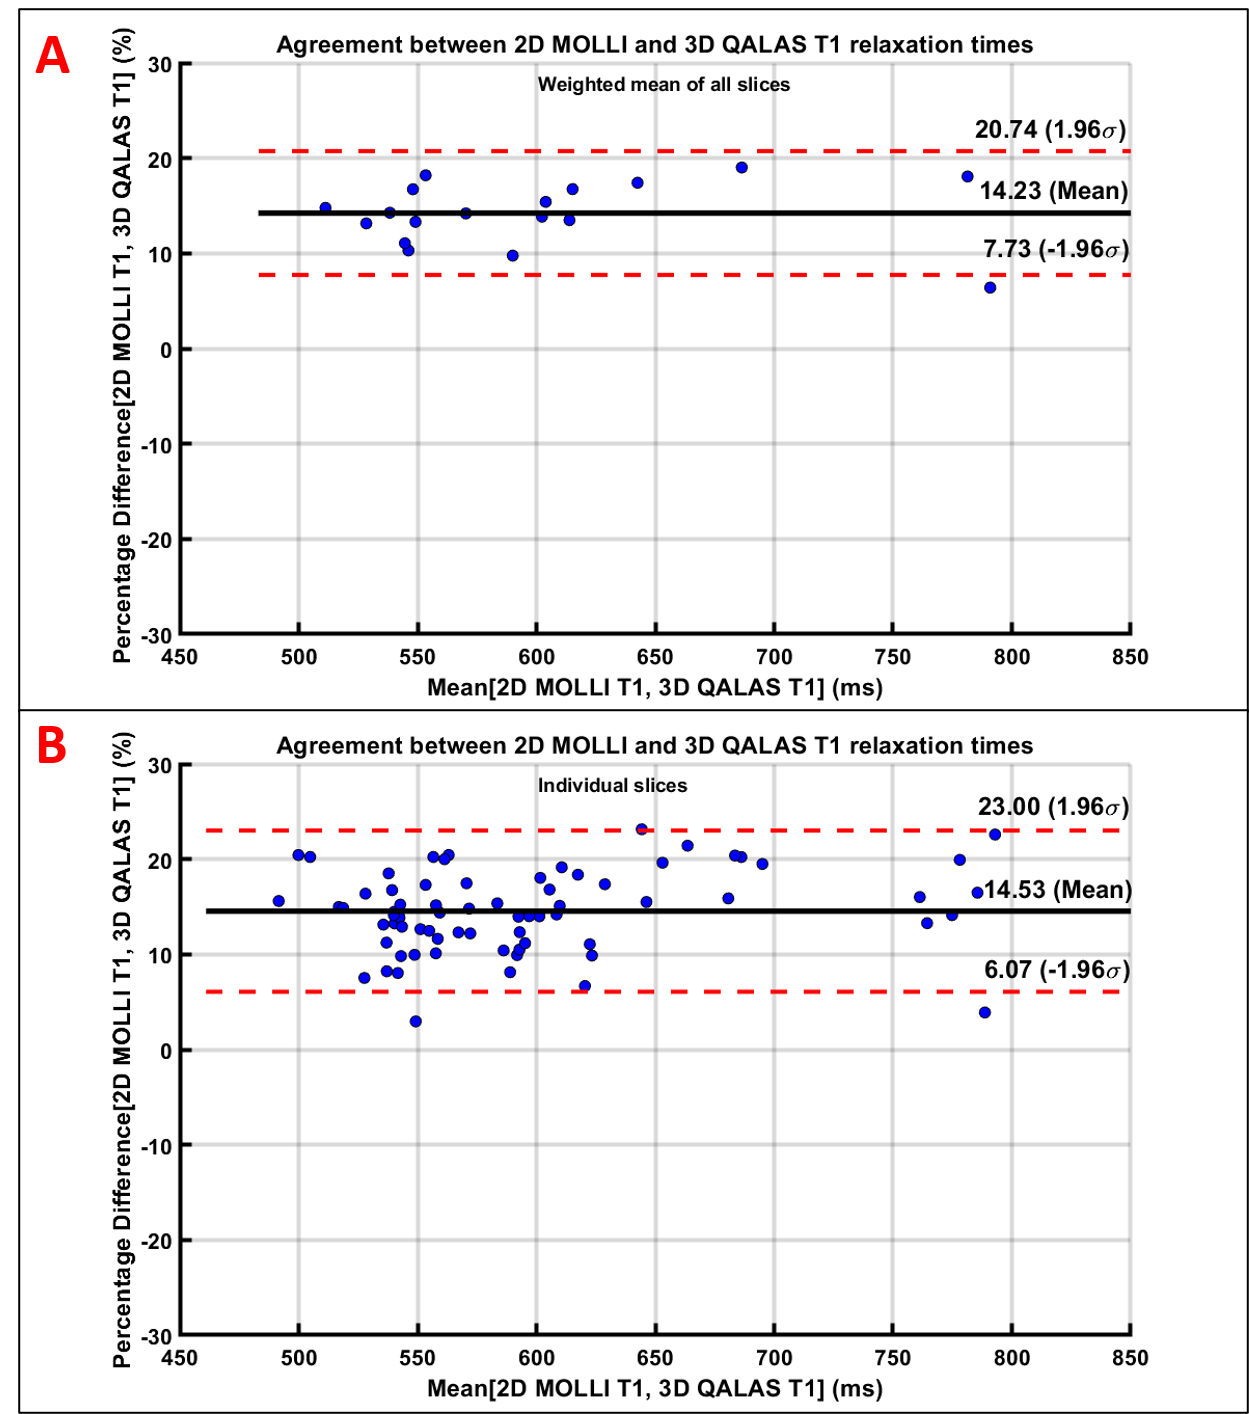
Figure 2. Bland-Altman plots of T1 hepatic values using 2D-MOLLI v/s 3D-QALAS (A)
mean T1 and (B) T1 of individual slices.