El-Sayed H Ibrahim1, Abdul Parchur1, Srividya Kidambi1, Allen Cowley1, and Mingyu Liang1
1Medical College of Wisconsin, Milwaukee, WI, United States
1Medical College of Wisconsin, Milwaukee, WI, United States
BOLD MRI is capable of monitoring acute changes in the regional
hemodynamics within the kidney. The variable responses seen in the imaged
subjects may reflect differences in salt-sensitive versus salt-insensitive
individuals
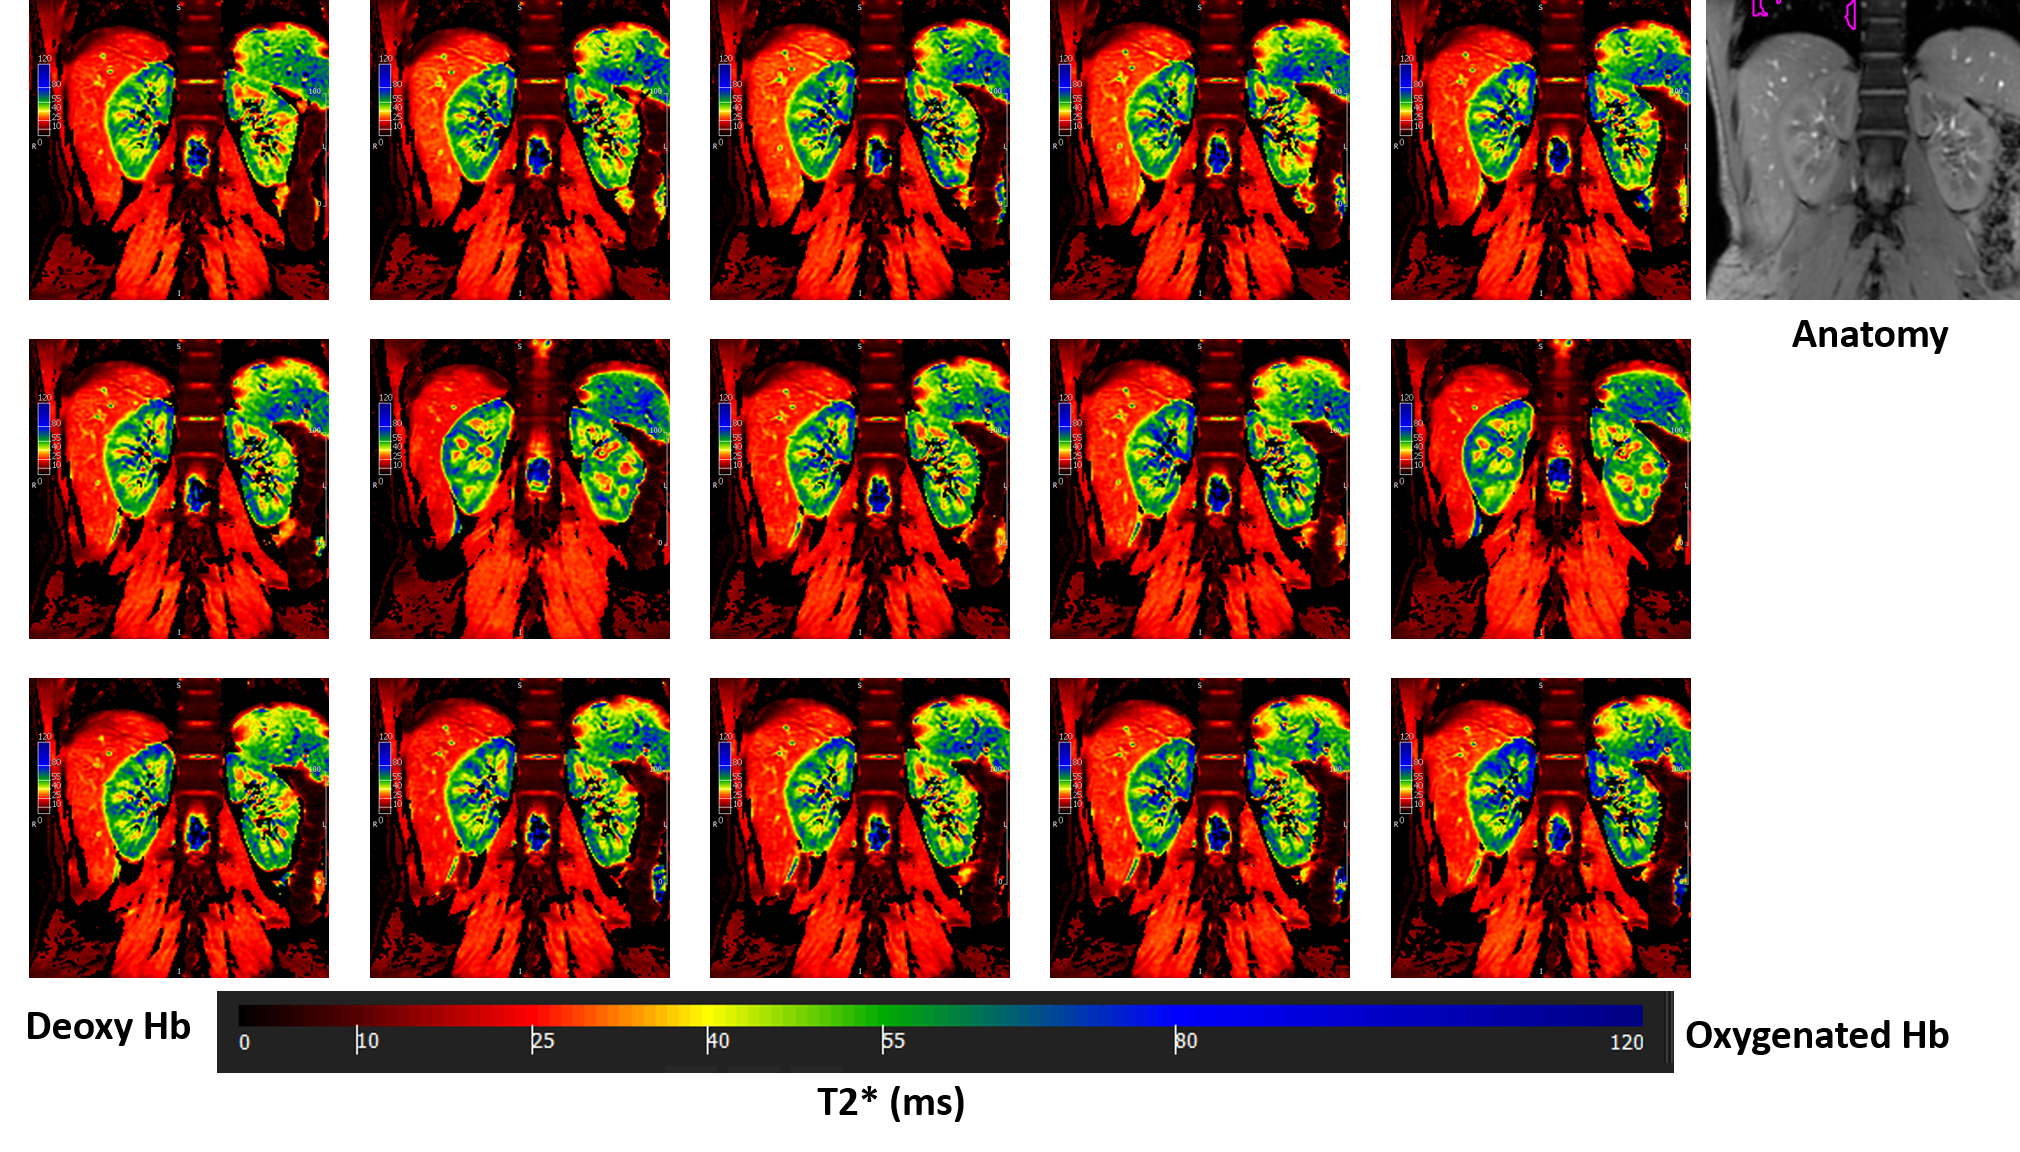
Fig 1. Sequential T2* BOLD images acquired in a volunteer during one hour of
saline infusion. An anatomical image is shown for reference. The images show
clear gradient in tissue oxygenation level between cortex and medulla,
represented by higher and lower T2* values, respectively, based on the T2*
color map (measured in ms).
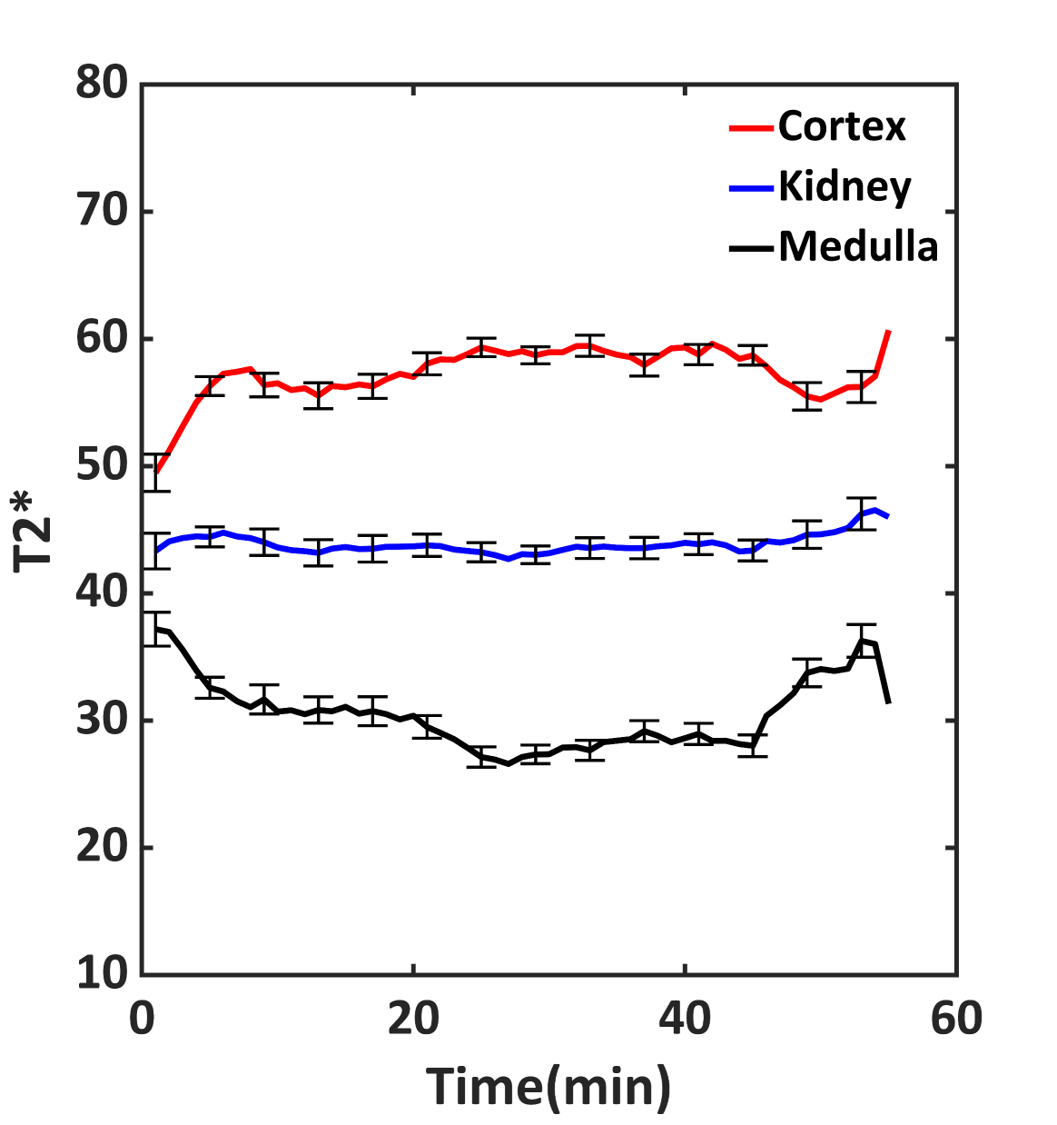
Fig 3. Average T2* values (ms) from all volunteers during one hour of
saline infusion. Average T2* in the kidney was constant, while T2* values in
the cortex were significantly higher than those in the medulla. Note changes in
T2* values at the beginning and end of the experiment when infusion rate was
lower than the rest of the experiment.