Soo Hyun Shin1, Michael F. Wendland2, and Moriel H. Vandsburger1
1Department of Bioengineering, University of California, Berkeley, Berkeley, CA, United States, 2Berkeley Preclinical Imaging Core (BPIC), University of California, Berkeley, Berkeley, CA, United States
1Department of Bioengineering, University of California, Berkeley, Berkeley, CA, United States, 2Berkeley Preclinical Imaging Core (BPIC), University of California, Berkeley, Berkeley, CA, United States
Upon renal injury progression, the urea CEST contrast decreased in the cortex, and the saline-induced fold change of contrast decreased in the inner medulla and papilla. qMT imaging showed the decrease of semi-solid macromolecule pool in the cortex.
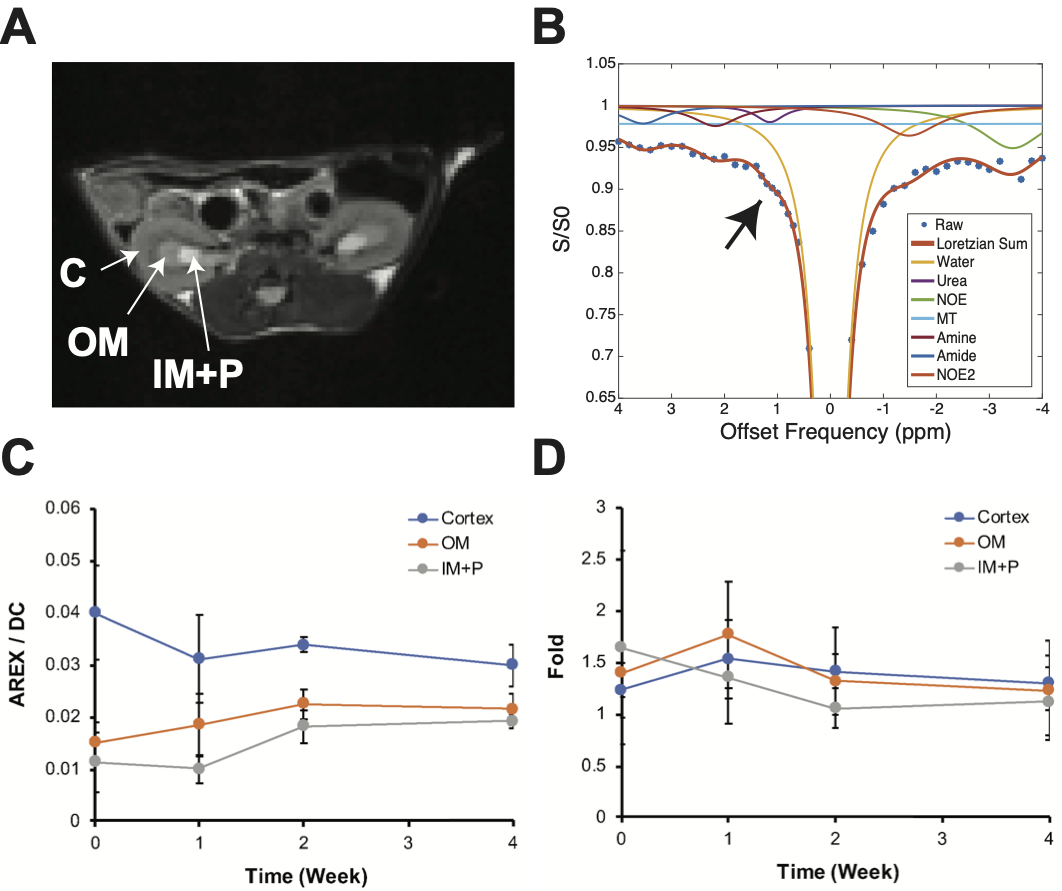
Figure 2. CEST data acquisition and contrast measurement. (A) A T2-weighted image for segmenting the kidneys into the cortex (C), outer medulla (OM), and inner medulla and papilla (IM+P). (B) A Z-spectrum from a cortex fitted with 7-pool Lorentzian functions. The black arrow indicates the urea contrast at +1 ppm. (C) 1 ppm AREX measurements over time at each kidney region. (D) Fold change of 1 ppm AREX induced by saline infusion measured at each kidney region. Error bars indicate standard error mean.
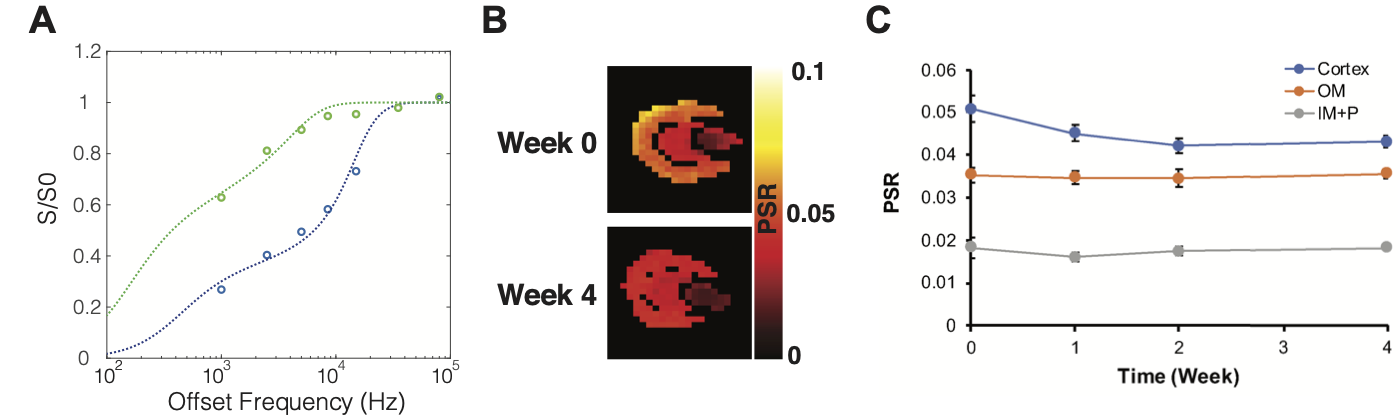
Figure 3. Quantitative MT (qMT) imaging data. (A) Example qMT spectra and fitting from a voxel in the cortex at two saturation powers (green – 220o flip angle, blue – 820o). (B) Pool size ratio (PSR) map of a kidney measured before cisplatin injection (week 0) and 4 weeks after multiple cisplatin injections. (C) PSR measurements over time in different anatomical regions in the kidney. Data are presented as mean ± standard error mean.