Eric D Carruth1, Samuel W Fielden1, Amro Alsaid1, Brandon K Fornwalt1, and Christopher M Haggerty1
1Geisinger, Danville, PA, United States
1Geisinger, Danville, PA, United States
In 18 individuals identified with genetic risk for arrhythmogenic cardiomyopathy from population genomic screening, we observed increased native myocardial T1, but unchanged T2, post-contrast T1, and sECV compared with controls.

Figure 1. Summary of comparisons between genotype-positive (G+) individuals and controls (G?). Values shown are mean±SEM, unless otherwise indicated. LVEF-left ventricular ejection fraction, RVEF-right ventricular ejection fraction, LGE-late gadolinium enhancement, sECV-synthetic extracellular volume. *p<0.05.
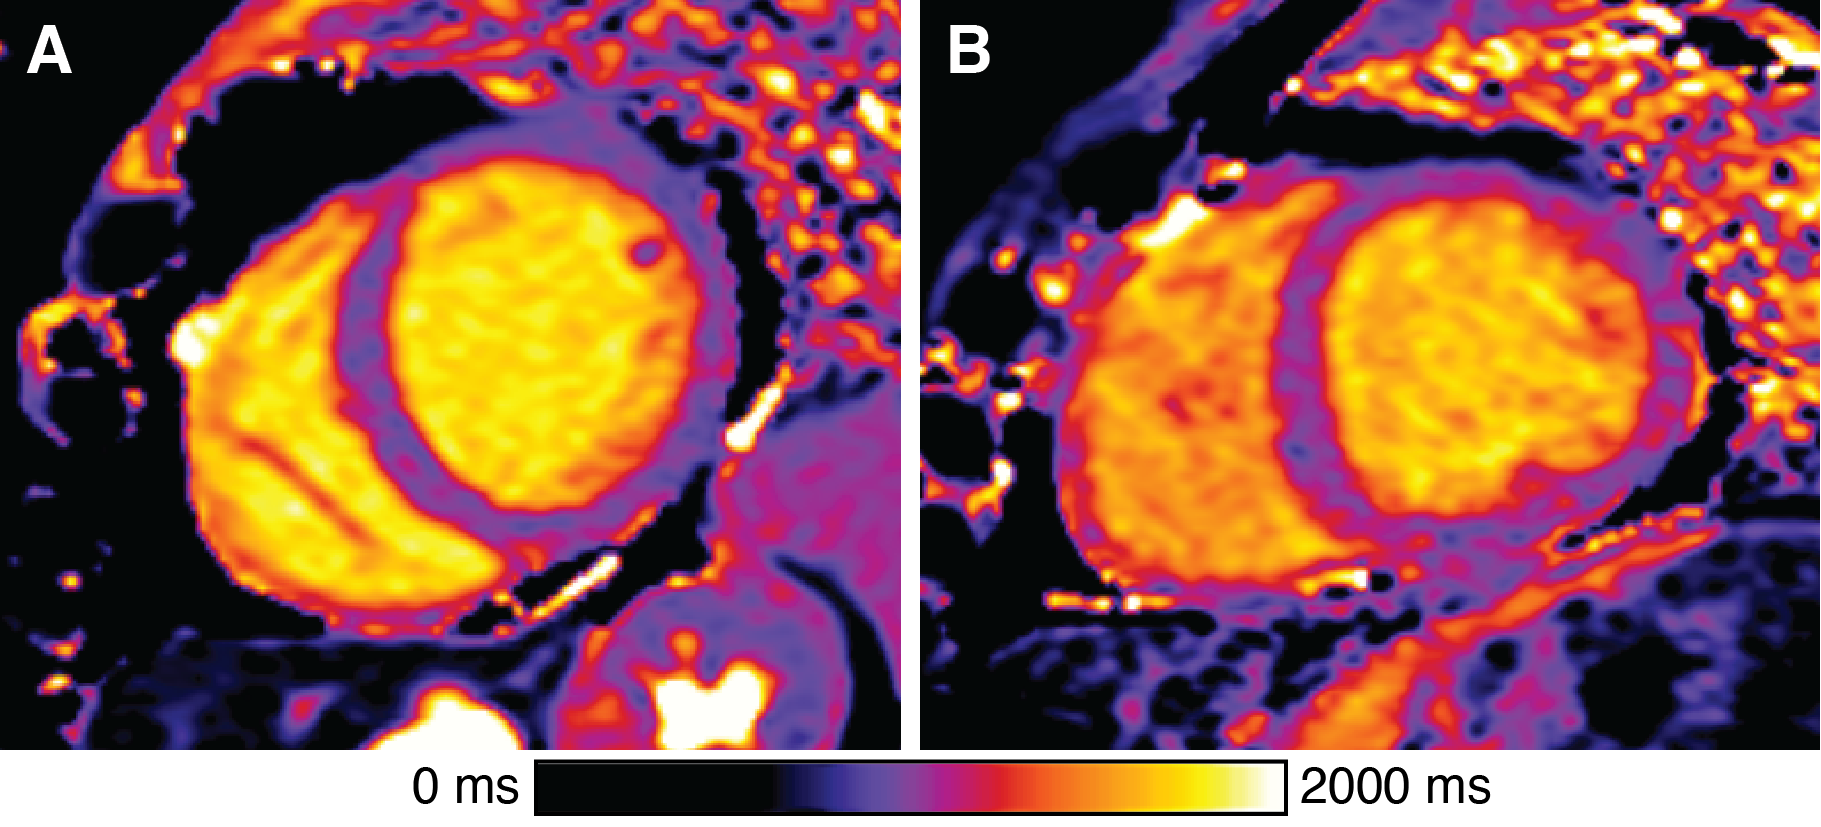
Figure 2. Native T1 maps in A) G? control and B) G+ variant-positive individuals. Representative patients were selected as those with the median native T1 value across each group. While subtle, elevated T1 values in the myocardium of the G+ patient left ventricle (LV) are evident.