Tomokazu Tsurugizawa1
1Human Informatics and Interaction Research Institute, National Institute of Advanced Industrial Science and Technology (AIST), Tsukuba, Japan
1Human Informatics and Interaction Research Institute, National Institute of Advanced Industrial Science and Technology (AIST), Tsukuba, Japan
Typical structure of resting state functional connectivity did not alter
under light anesthesia compared with awake state, but connectivity strength and
fractional amplitude of low frequency fluctuation significantly decreased under
light anesthesia.
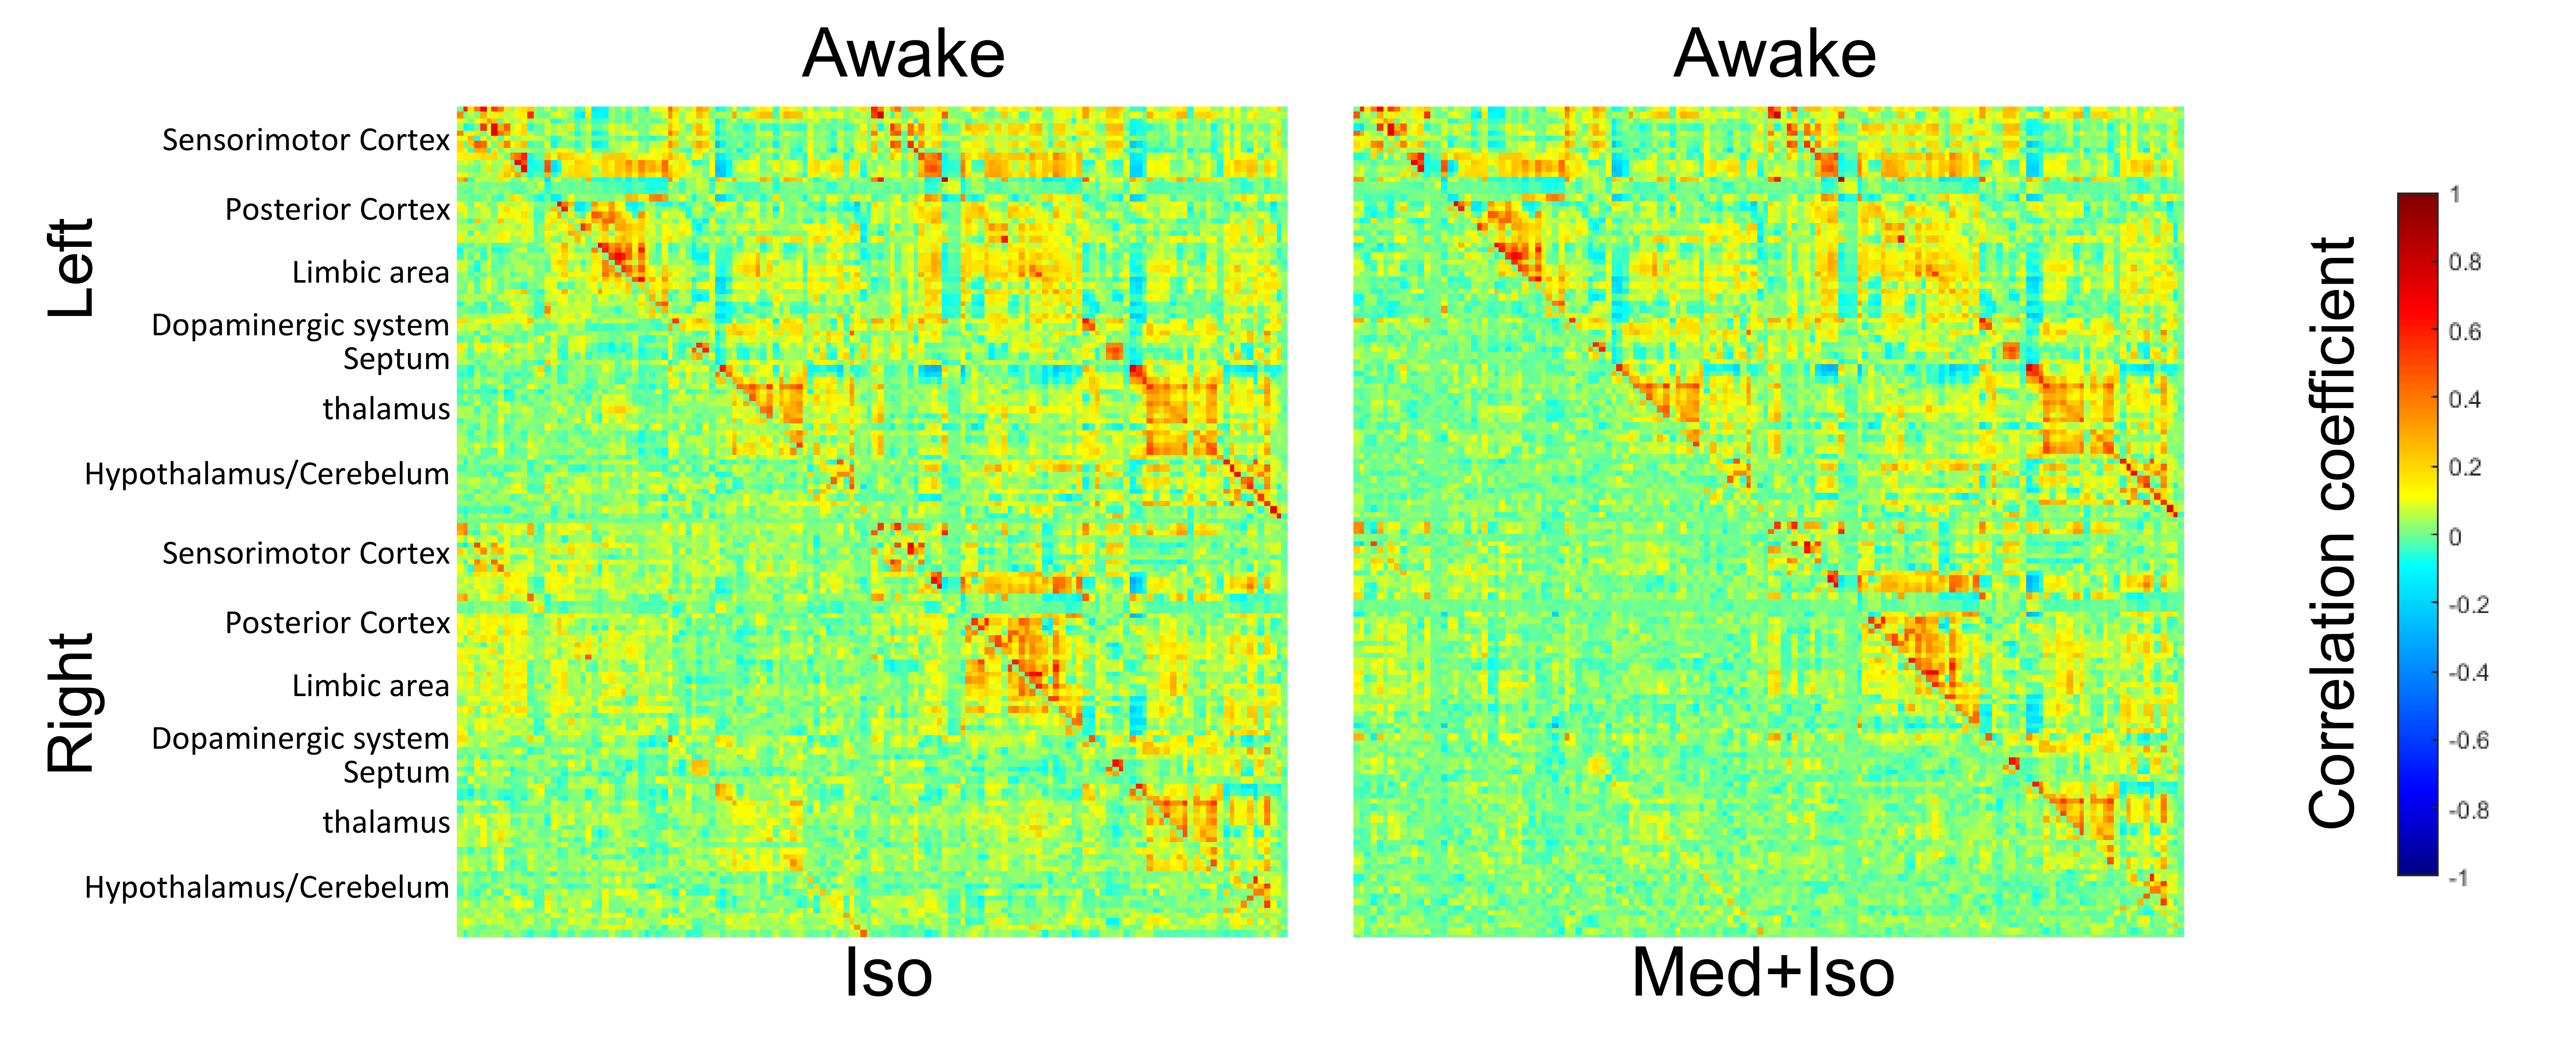
Figure 2 Averaged functional connectivity matrices under (left panel) ISO anesthesia (lower left) and awake state (upper right), and (right panel) MED + ISO anesthesia (lower left) and awake state (upper right). Color bar represents the Pearson correlation coefficients.

Figure 3 Significant changes of correlation coefficients (A) under ISO anesthesia and (B) under MED + ISO anesthesia compared with awake state. Right upper triangle panel shows the significant changes (p < 0.05, network-based statistic). Left lower panel shows the t-values. Figures are reconstructed significant changes in functional connectivity. Color bar shows t-values.