Daniel Uher1, Ari Väärälä1, Antti Isosalo1, Victor Casula1,2, and Miika T. Nieminen1,2,3
1Research Unit of Medical Imaging, Physics and Technology, University of Oulu, Oulu, Finland, 2Medical Research Center, University of Oulu and Oulu University Hospital, Oulu, Finland, 3Department of Diagnostic Radiology, Oulu University Hospital, Oulu, Finland
1Research Unit of Medical Imaging, Physics and Technology, University of Oulu, Oulu, Finland, 2Medical Research Center, University of Oulu and Oulu University Hospital, Oulu, Finland, 3Department of Diagnostic Radiology, Oulu University Hospital, Oulu, Finland
3D Texture Analysis of DESS images showed promising predictive
capability for the onset of Osteoarthritis occurring within three years. High
accuracy (86%) was achieved using Naïve Bayes classifier on selected textural
features from tibial cartilage.

Figure 2. Example of the
cartilage layers implemented in the 3D Texture Analysis. Blue dashed line
represents the thickness of the cartilage. L10, L50, L90 show the layer
heights, in which the cartilage was analyzed. SUM represents the full cartilage
thickness.
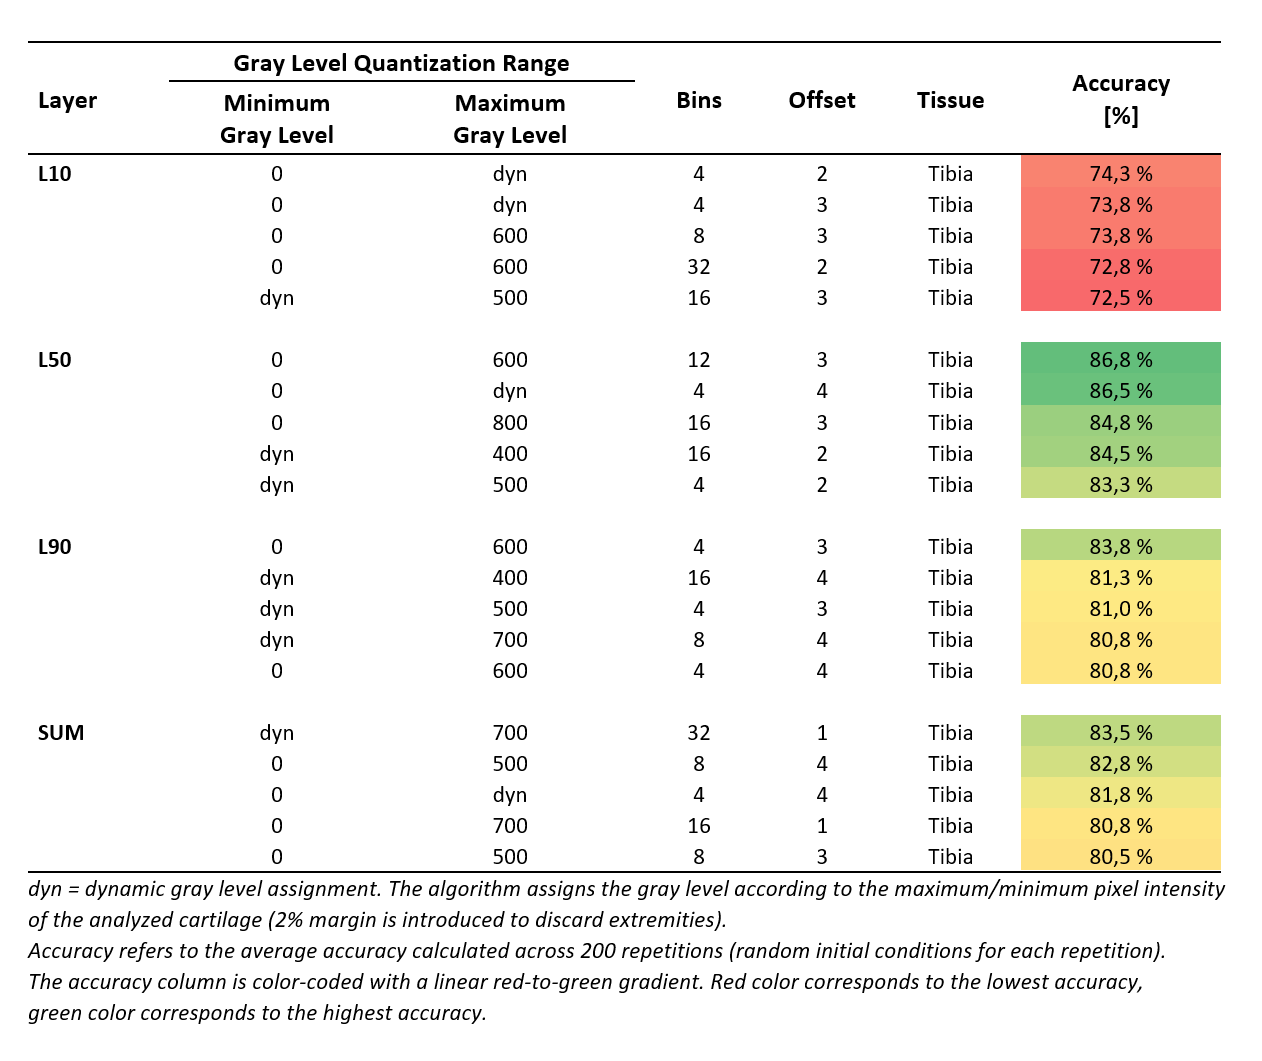
Table 1. Five best performing 3D Texture Analysis outputs (sorted by accuracy)
per each layer using Naïve Bayes
and selected tibial features.