1The Edmond and Lily Safra Center for Brain Sciences, The Hebrew University of Jerusalem, Jerusalem, Israel
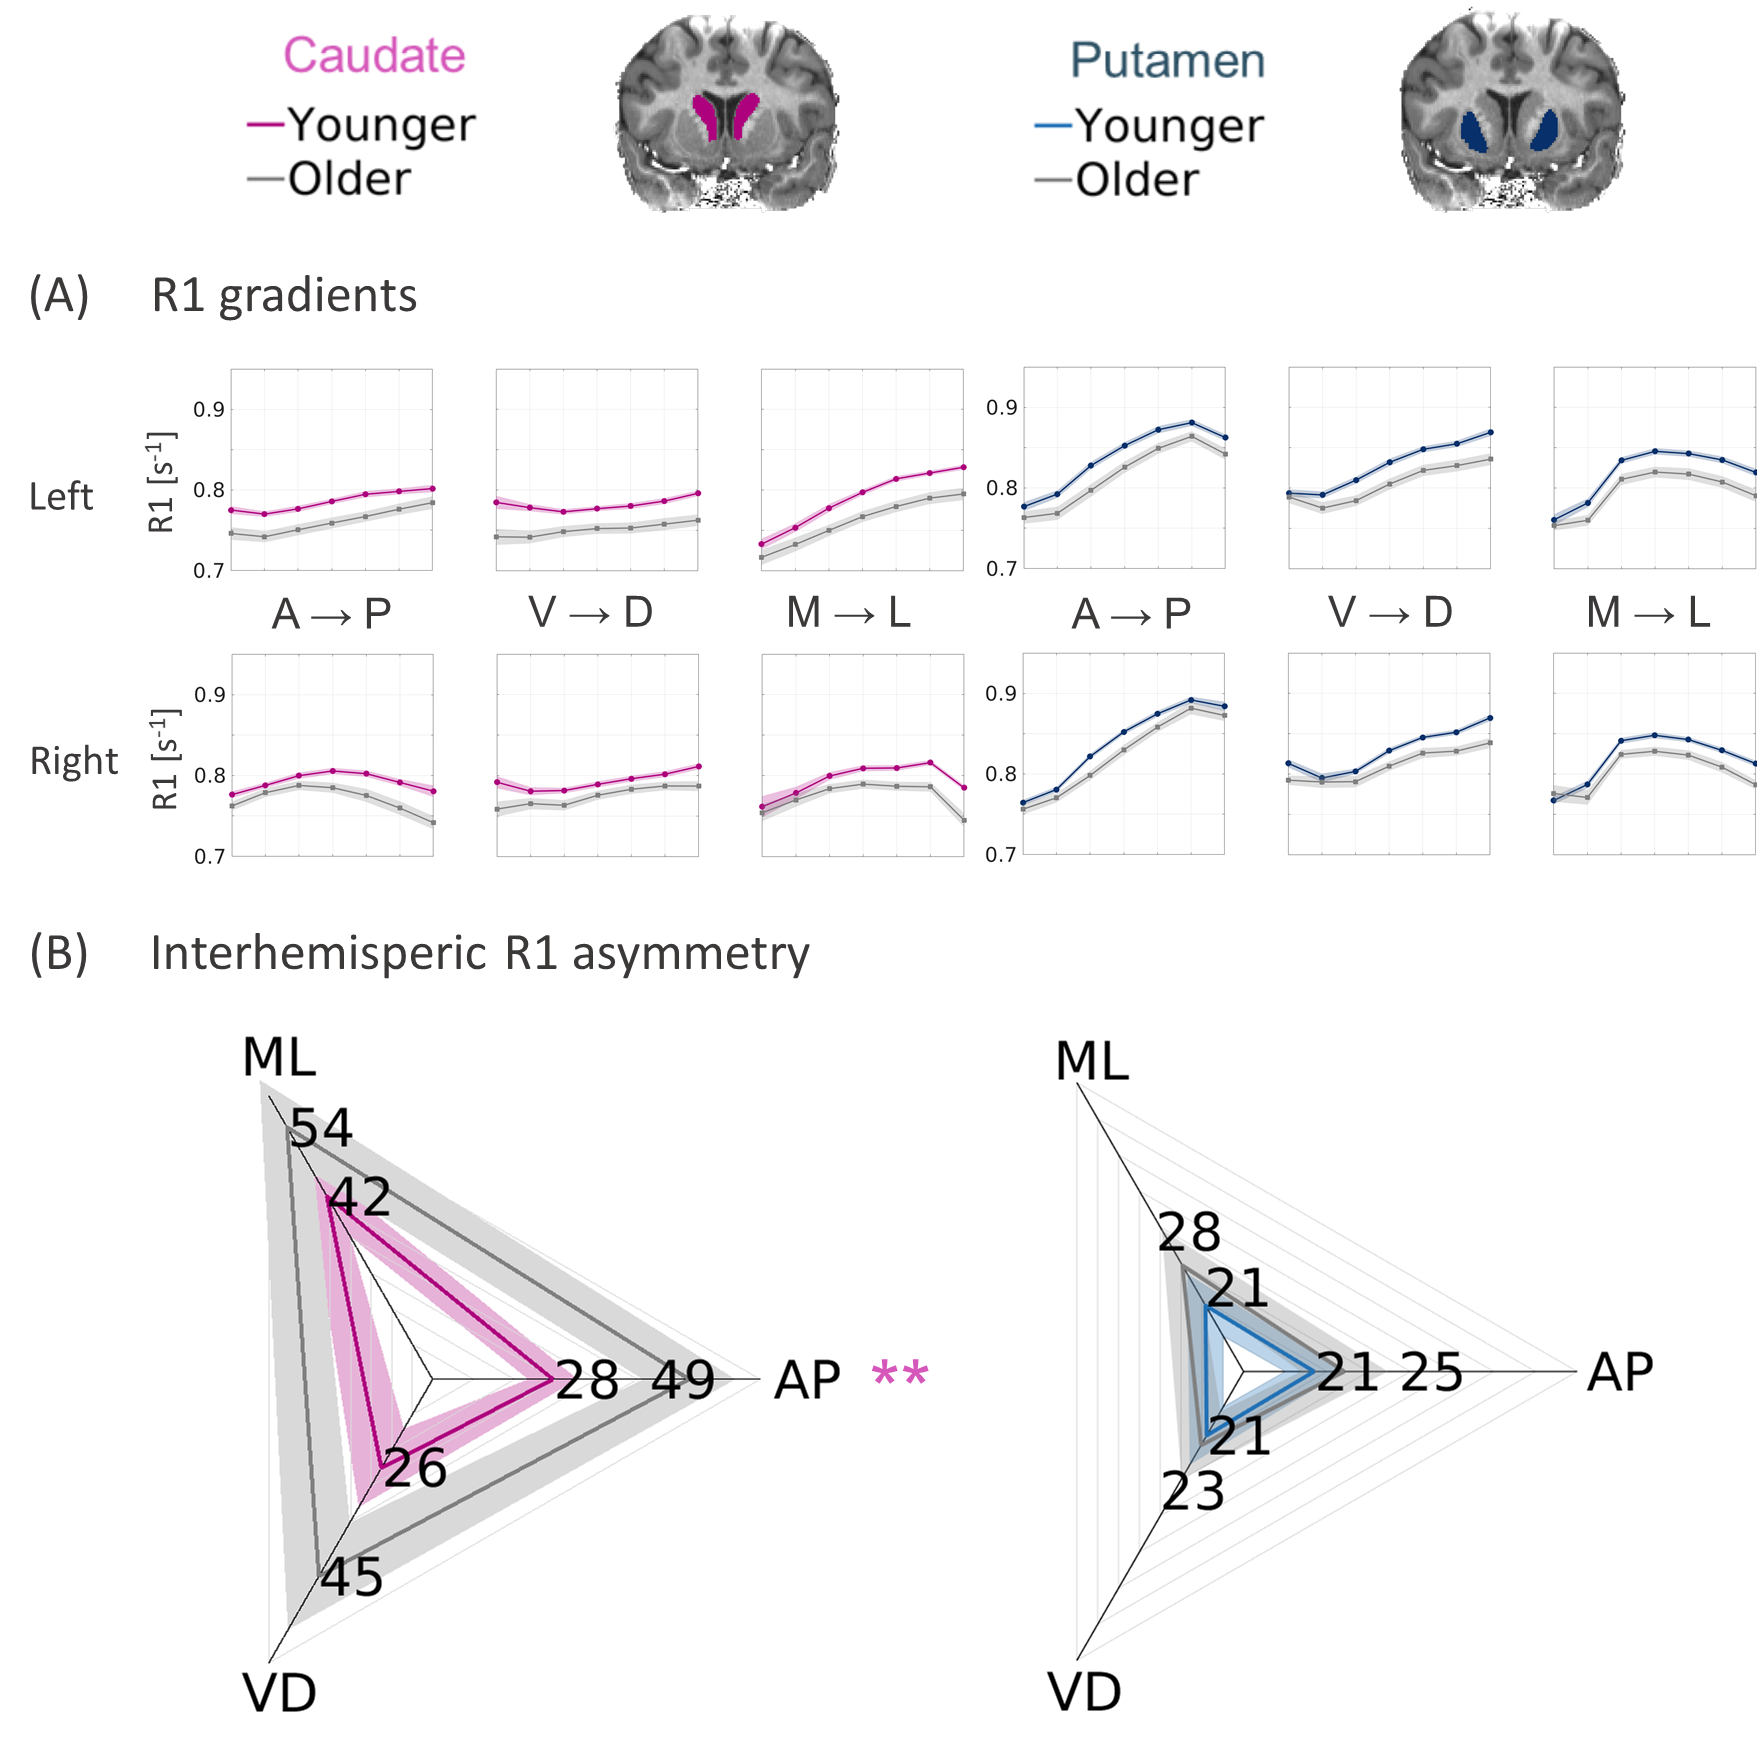
Microstructural gradients in the striatum show aging-related changes.
(A) R1 functions along the main axes of the caudate (left) and putamen (right), averaged across 20 young adults and 18 older adults. Shaded area = ±1 SEM.
(B) Interhemispheric asymmetry is shown for 3 axes of the caudate and putamen, averaged across young and older adults. Asymmetry is defined as within-subject mean difference (MAE) between the left-hemisphere and right-hemisphere 1/R1 functions [ms]. Shaded area = ±1 STD.
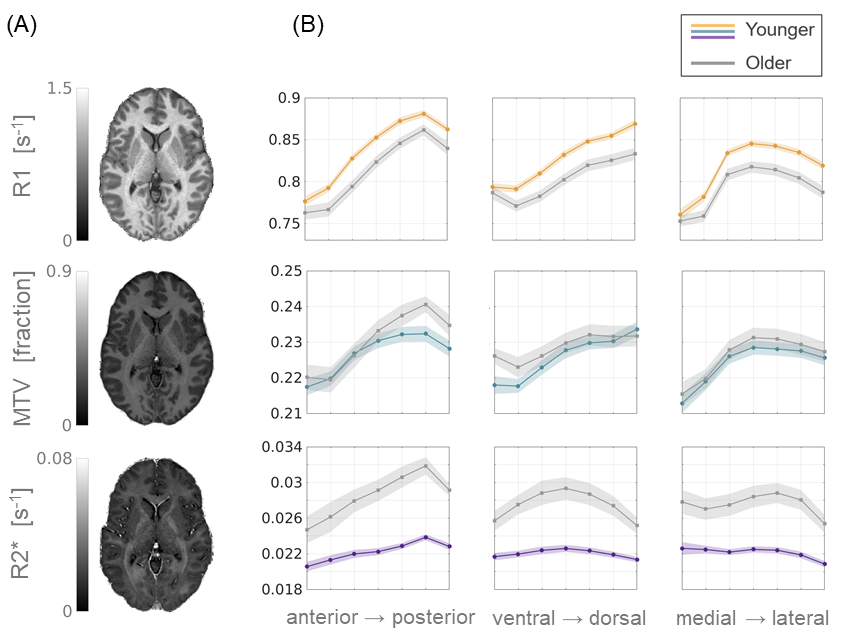
Different qMRI parameters show distinct spatial and aging-related changes.
(A) Representative axial slices of R1, MTV and R2* mappings, showing sensitivity to myelin, non-water content and iron concentration, respectively. (B) Spatial variability profiles of the different qMRI parameters along the anterior-posterior (left), ventral-dorsal (middle) and medial-lateral (right) axes of the putamen. Averaged across young (N=17) and older adults (N=16). Shaded area is ± 1 SEM.
