Hyebin Lee1,2, Kyoungseob Byeon1,2, Sean H. Lee3, and Hyunjin Park2,4
1Department of Electrical and Computer Engineering, Sungkyunkwan University, Suwon, Korea, Republic of, 2Center for Neuroscience Imaging Research, Institute for Basic Science (IBS), Suwon, Korea, Republic of, 3Department of Neuroscience, Max Planck Institute for Empirical Aesthetics, Frankfurt am Main, Germany, 4School of Electronic and Electrical Engineering, Sungkyunkwan University, Suwon, Korea, Republic of
1Department of Electrical and Computer Engineering, Sungkyunkwan University, Suwon, Korea, Republic of, 2Center for Neuroscience Imaging Research, Institute for Basic Science (IBS), Suwon, Korea, Republic of, 3Department of Neuroscience, Max Planck Institute for Empirical Aesthetics, Frankfurt am Main, Germany, 4School of Electronic and Electrical Engineering, Sungkyunkwan University, Suwon, Korea, Republic of
Our analysis pipeline
parcellated the human auditory cortex into three clusters, the central and two
other flanking parts. Each cluster exhibited a distinct functional connectivity
pattern indicating its contribution to different functional networks.
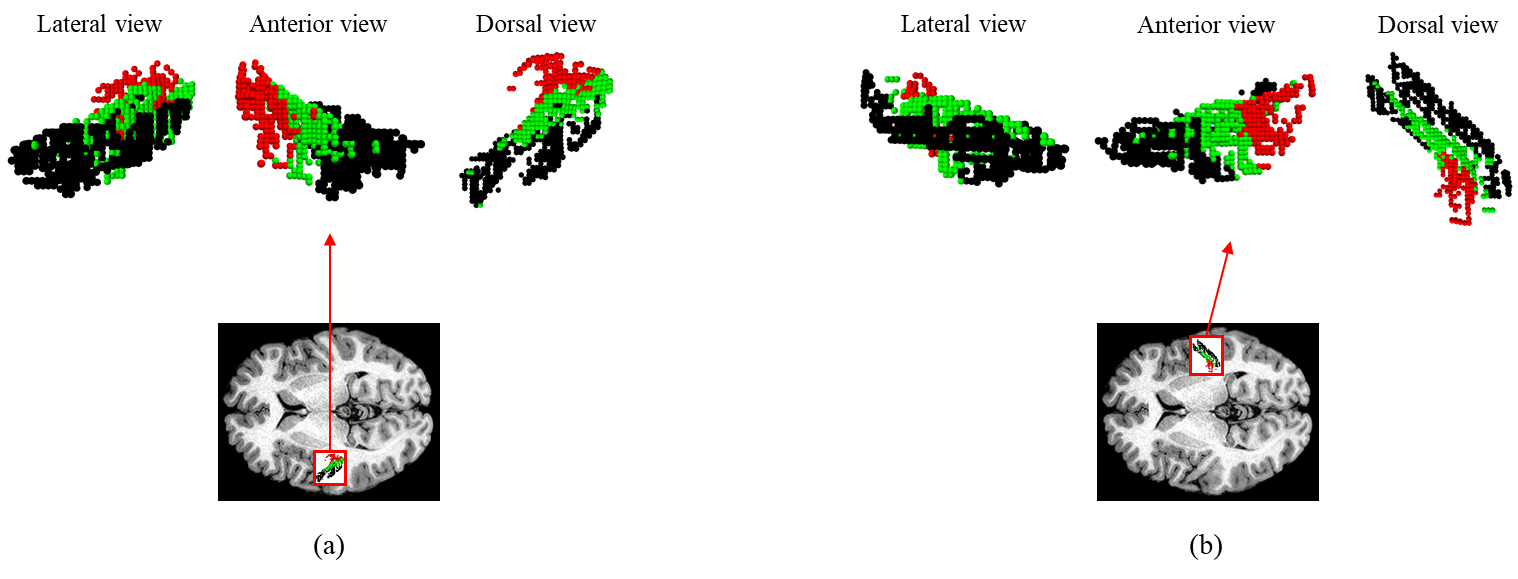
Fig. 2: Parcellation
results of the primary auditory cortex for (a) left and (b) right hemisphere. Cluster
1 (black) showed the strongest SC to STG. Cluster 2 (green) was located in
gyrus part of HG. Cluster 3 (red) showed strong SC to insula.
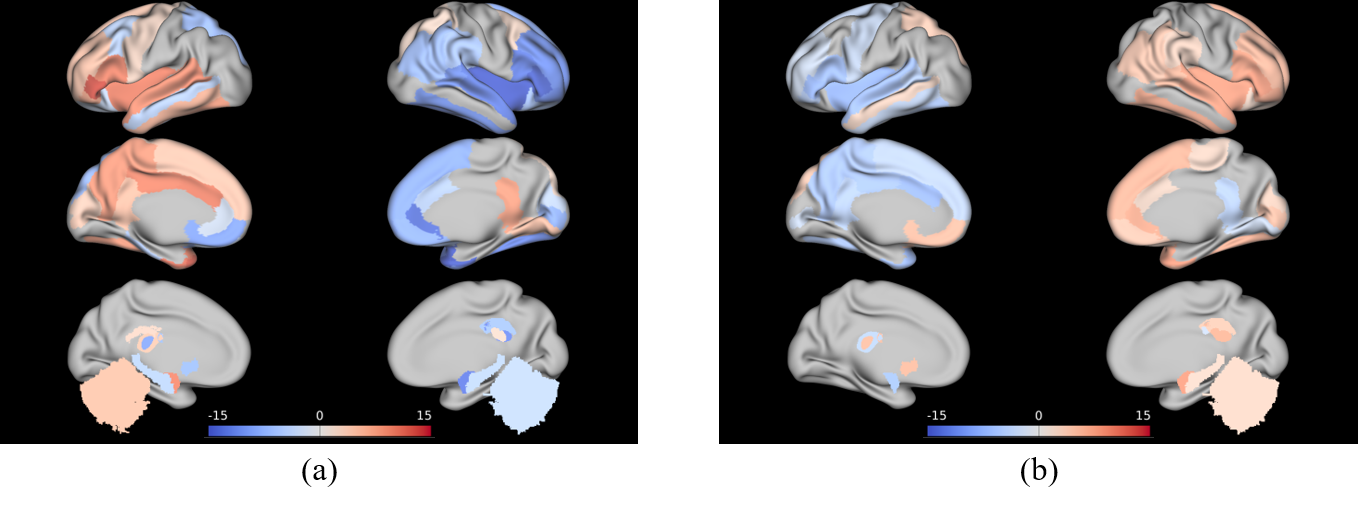
Fig. 3: T-values for regions with significantly
different mean FC visualized in the atlas space. Positive
t-values are presented as red color which implies the mean FC values in a pair
of regions satisfy cluster1 > cluster3. Negative t-values are presented as
blue color which implies the mean FC values in a pair of regions satisfy cluster1
< cluster3. The seed is located in (a) the left hemisphere and
(b) the right hemisphere, respectively.