Yan Jiang1, Mohammed Ayoub Alaoui Mhamdi1, and Russell Butler1,2
1Bishop's University, sherbrooke, QC, Canada, 2Diagnostic Radiology, University of Sherbrooke, sherbrooke, QC, Canada
1Bishop's University, sherbrooke, QC, Canada, 2Diagnostic Radiology, University of Sherbrooke, sherbrooke, QC, Canada
By investigating physiological contributions to REHO across 412 subjects
in 9 datasets, we conclude that, due to the significant correlation with multiple
artifacts of non-neuronal origin, REHO should be used with caution to infer
differences in neuronal activity across groups.

Figure
5. correlation REHO vs Respiration Rate, Heart Rate, Motion Parameters and FWHM
inter-group.
(a) Scatter plots of REHO (before correcting the fMRI data
using BlurToFWHM) vs artifects. (b) Correlation of REHO in each voxel vs
artifects across 9 datasets. (c) Scatter plots of REHO (after BlurToFWHM) vs
artifects. (d) Correlation of REHO in each voxel vs artifects across 9
datasets. (e) Scatter plots of REHO (after BlurToFWHM and regression) vs
artifects.
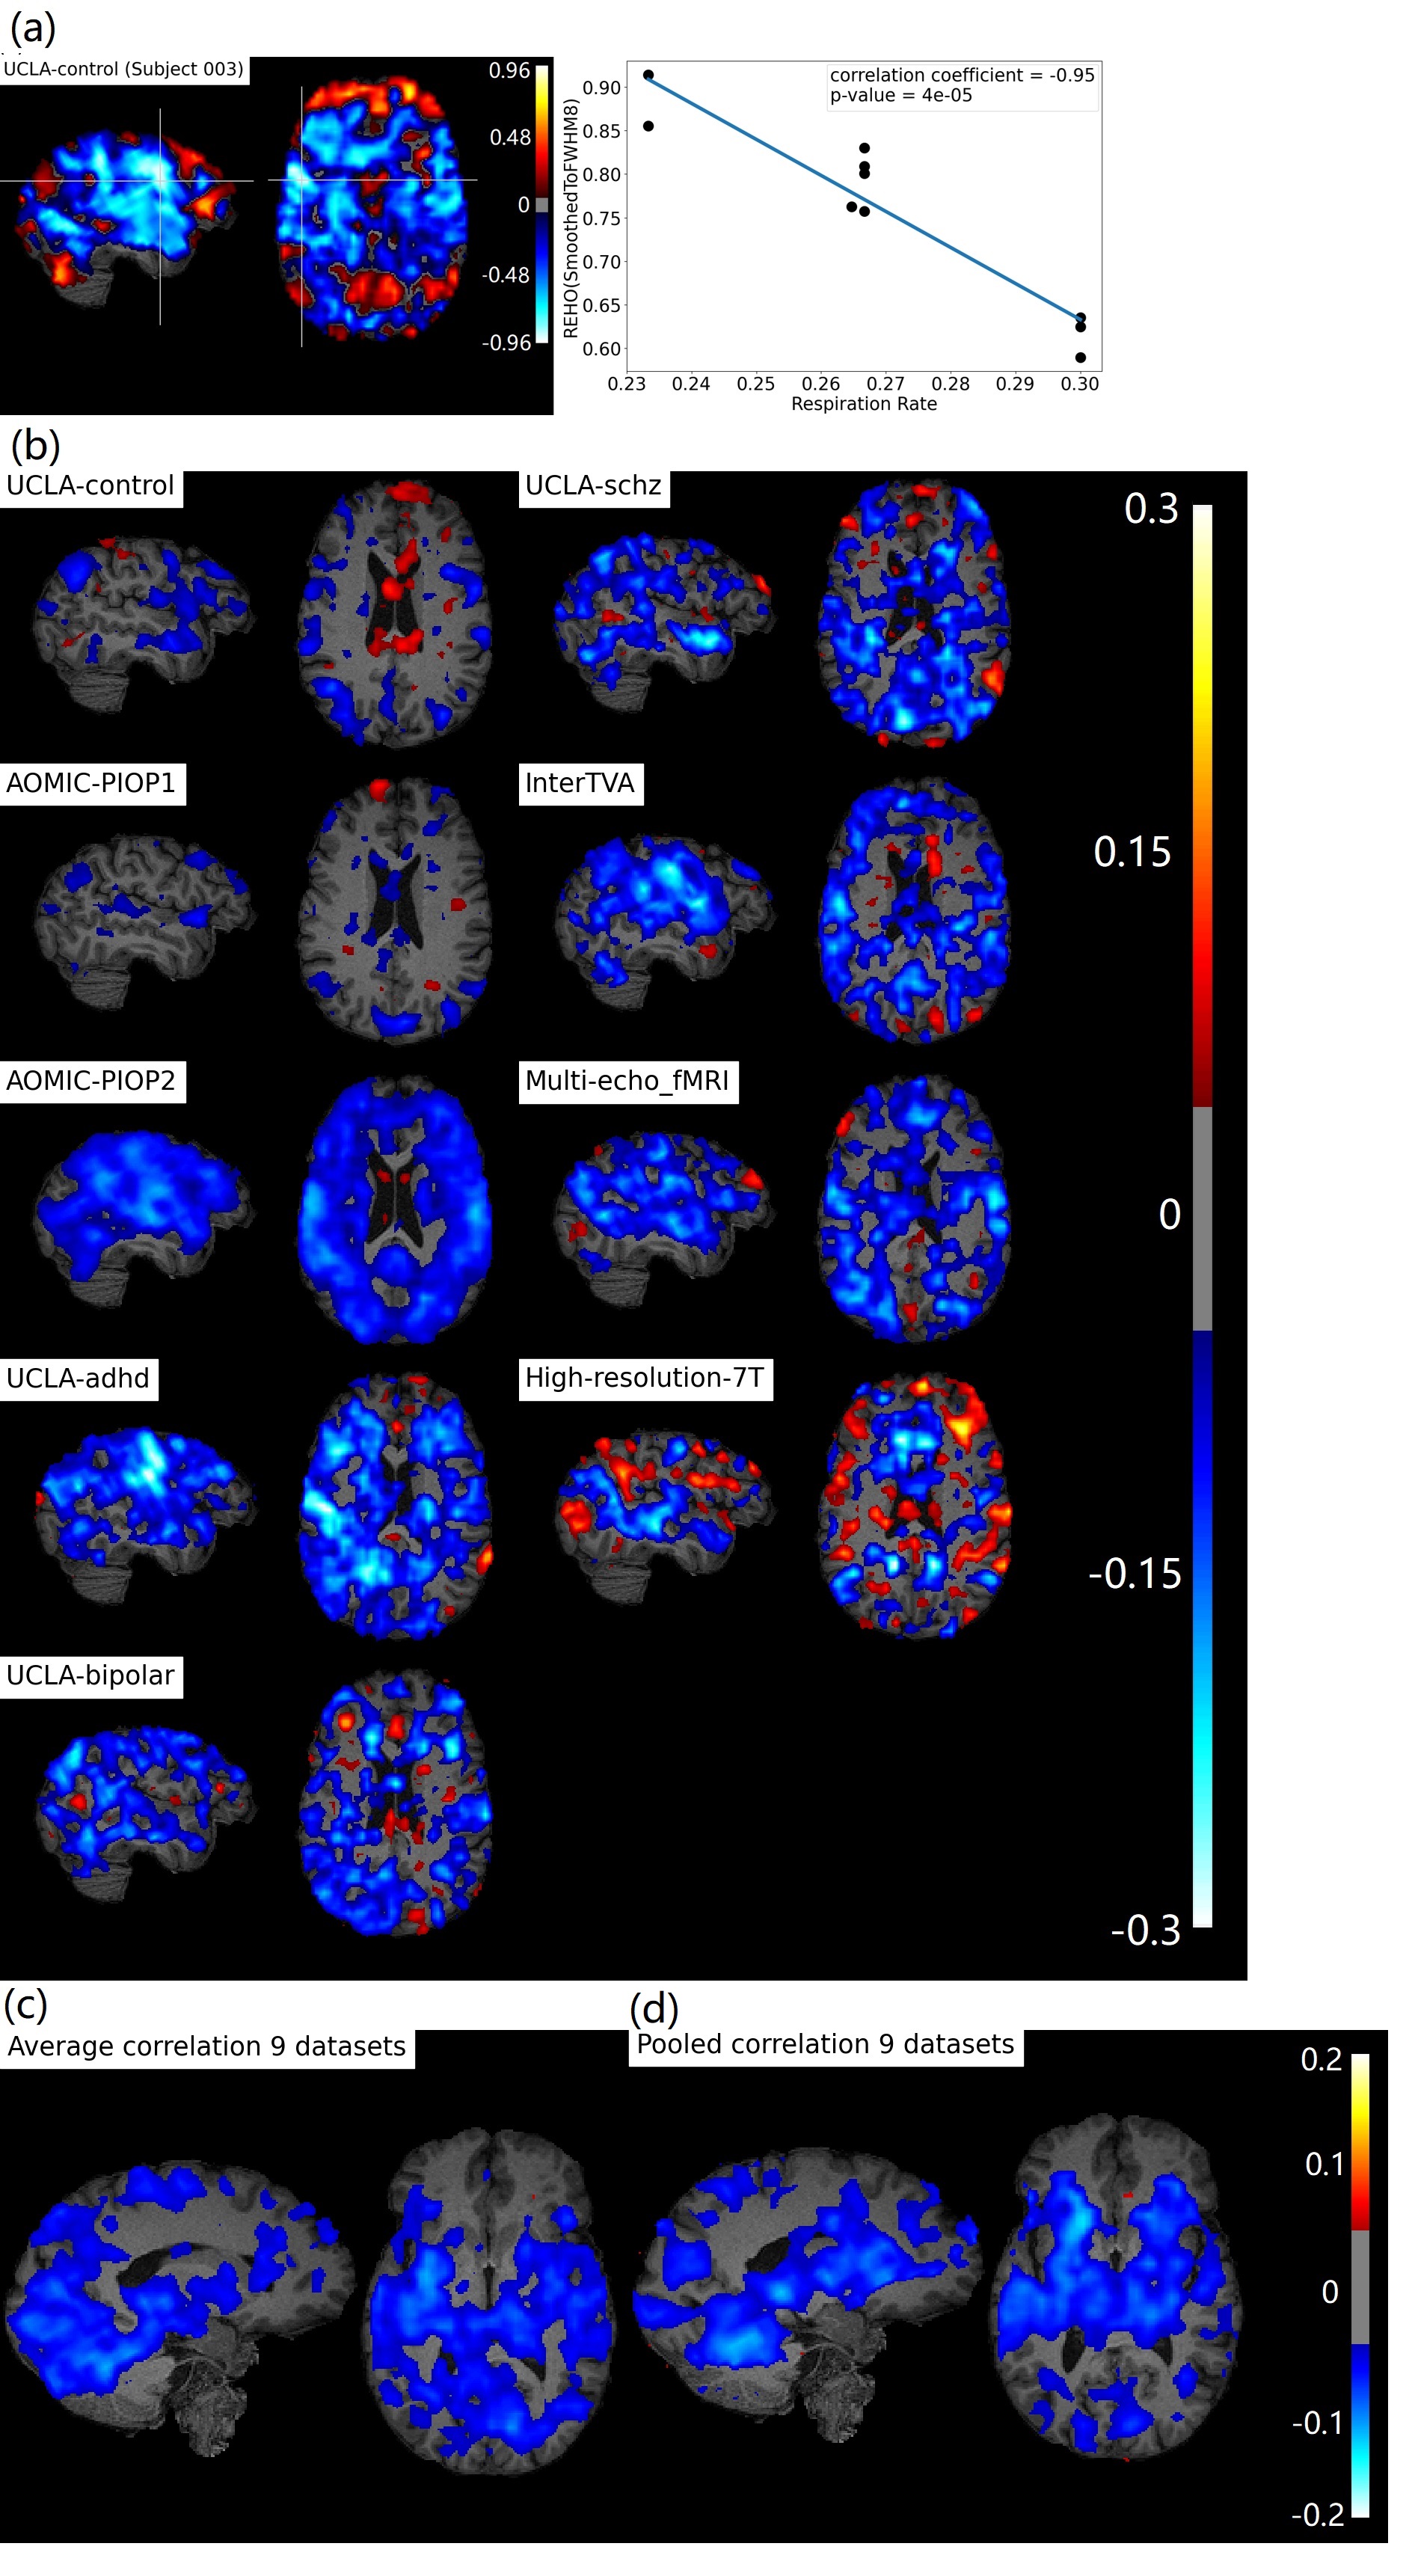
Figure 2. Correlation
maps of REHO vs Respiration Rate across time inter-subject heterogeneity.
(a) a scatter plot showing the correlation in
the cross marked voxel. (b) Average correlations between the REHO of 10
segments (3D+time data was divided across time) and the respiratory series in
each voxel of each subjects. (c) Average correlation map of 9 datasets. (d)
Correlation map calculated by pooling all 4120 REHO sub-bricks together.