Melissa T. Hooijmans1,2, Crystal L. Coolbaugh3, Xingyu Zhou2,4, Mark K. George2, and Bruce M. Damon4,5,6
1Department of Radiology & Nuclear Medicine, Amsterdam Movement Sciences, Amsterdam UMC, Location AMC, Amsterdam, Netherlands, 2Vanderbilt University Institute of Imaging Science, Nashville, TN, United States, 3Vanderbilt University Institute of Imaging Sciences, Nashville, TN, United States, 4Department of Biomedical Engineering, Vanderbilt University Medical Center, Nashville, TN, United States, 5Department of Radiology & Radiological Sciences, Vanderbilt University Medical Center, Nashville, TN, United States, 6Department of Molecular Physiology & Biophysics, Vanderbilt University Medical Center, Nashville, TN, United States
1Department of Radiology & Nuclear Medicine, Amsterdam Movement Sciences, Amsterdam UMC, Location AMC, Amsterdam, Netherlands, 2Vanderbilt University Institute of Imaging Science, Nashville, TN, United States, 3Vanderbilt University Institute of Imaging Sciences, Nashville, TN, United States, 4Department of Biomedical Engineering, Vanderbilt University Medical Center, Nashville, TN, United States, 5Department of Radiology & Radiological Sciences, Vanderbilt University Medical Center, Nashville, TN, United States, 6Department of Molecular Physiology & Biophysics, Vanderbilt University Medical Center, Nashville, TN, United States
Using an easily translatable
simulation approach. optimized elliptical filter parameters
were found for accurate strain quantification in skeletal muscle in a range of
strain levels.
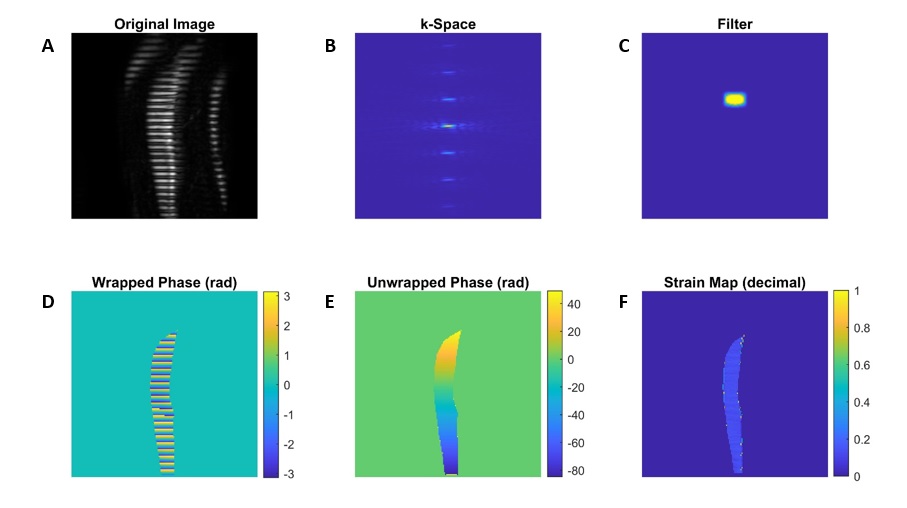
Figure 1. An overview
of the individual steps used for strain quantification in a representative
dataset. The original magnitude image (A), the Fourier Transform (FT) of the
magnitude image (k-space) (B),an elliptical filter used to isolate the first
harmonic peak (C), the inverse FT of the modified k-space (D), the unwrapped phase
image (E) and the quantitative strain
map (F).
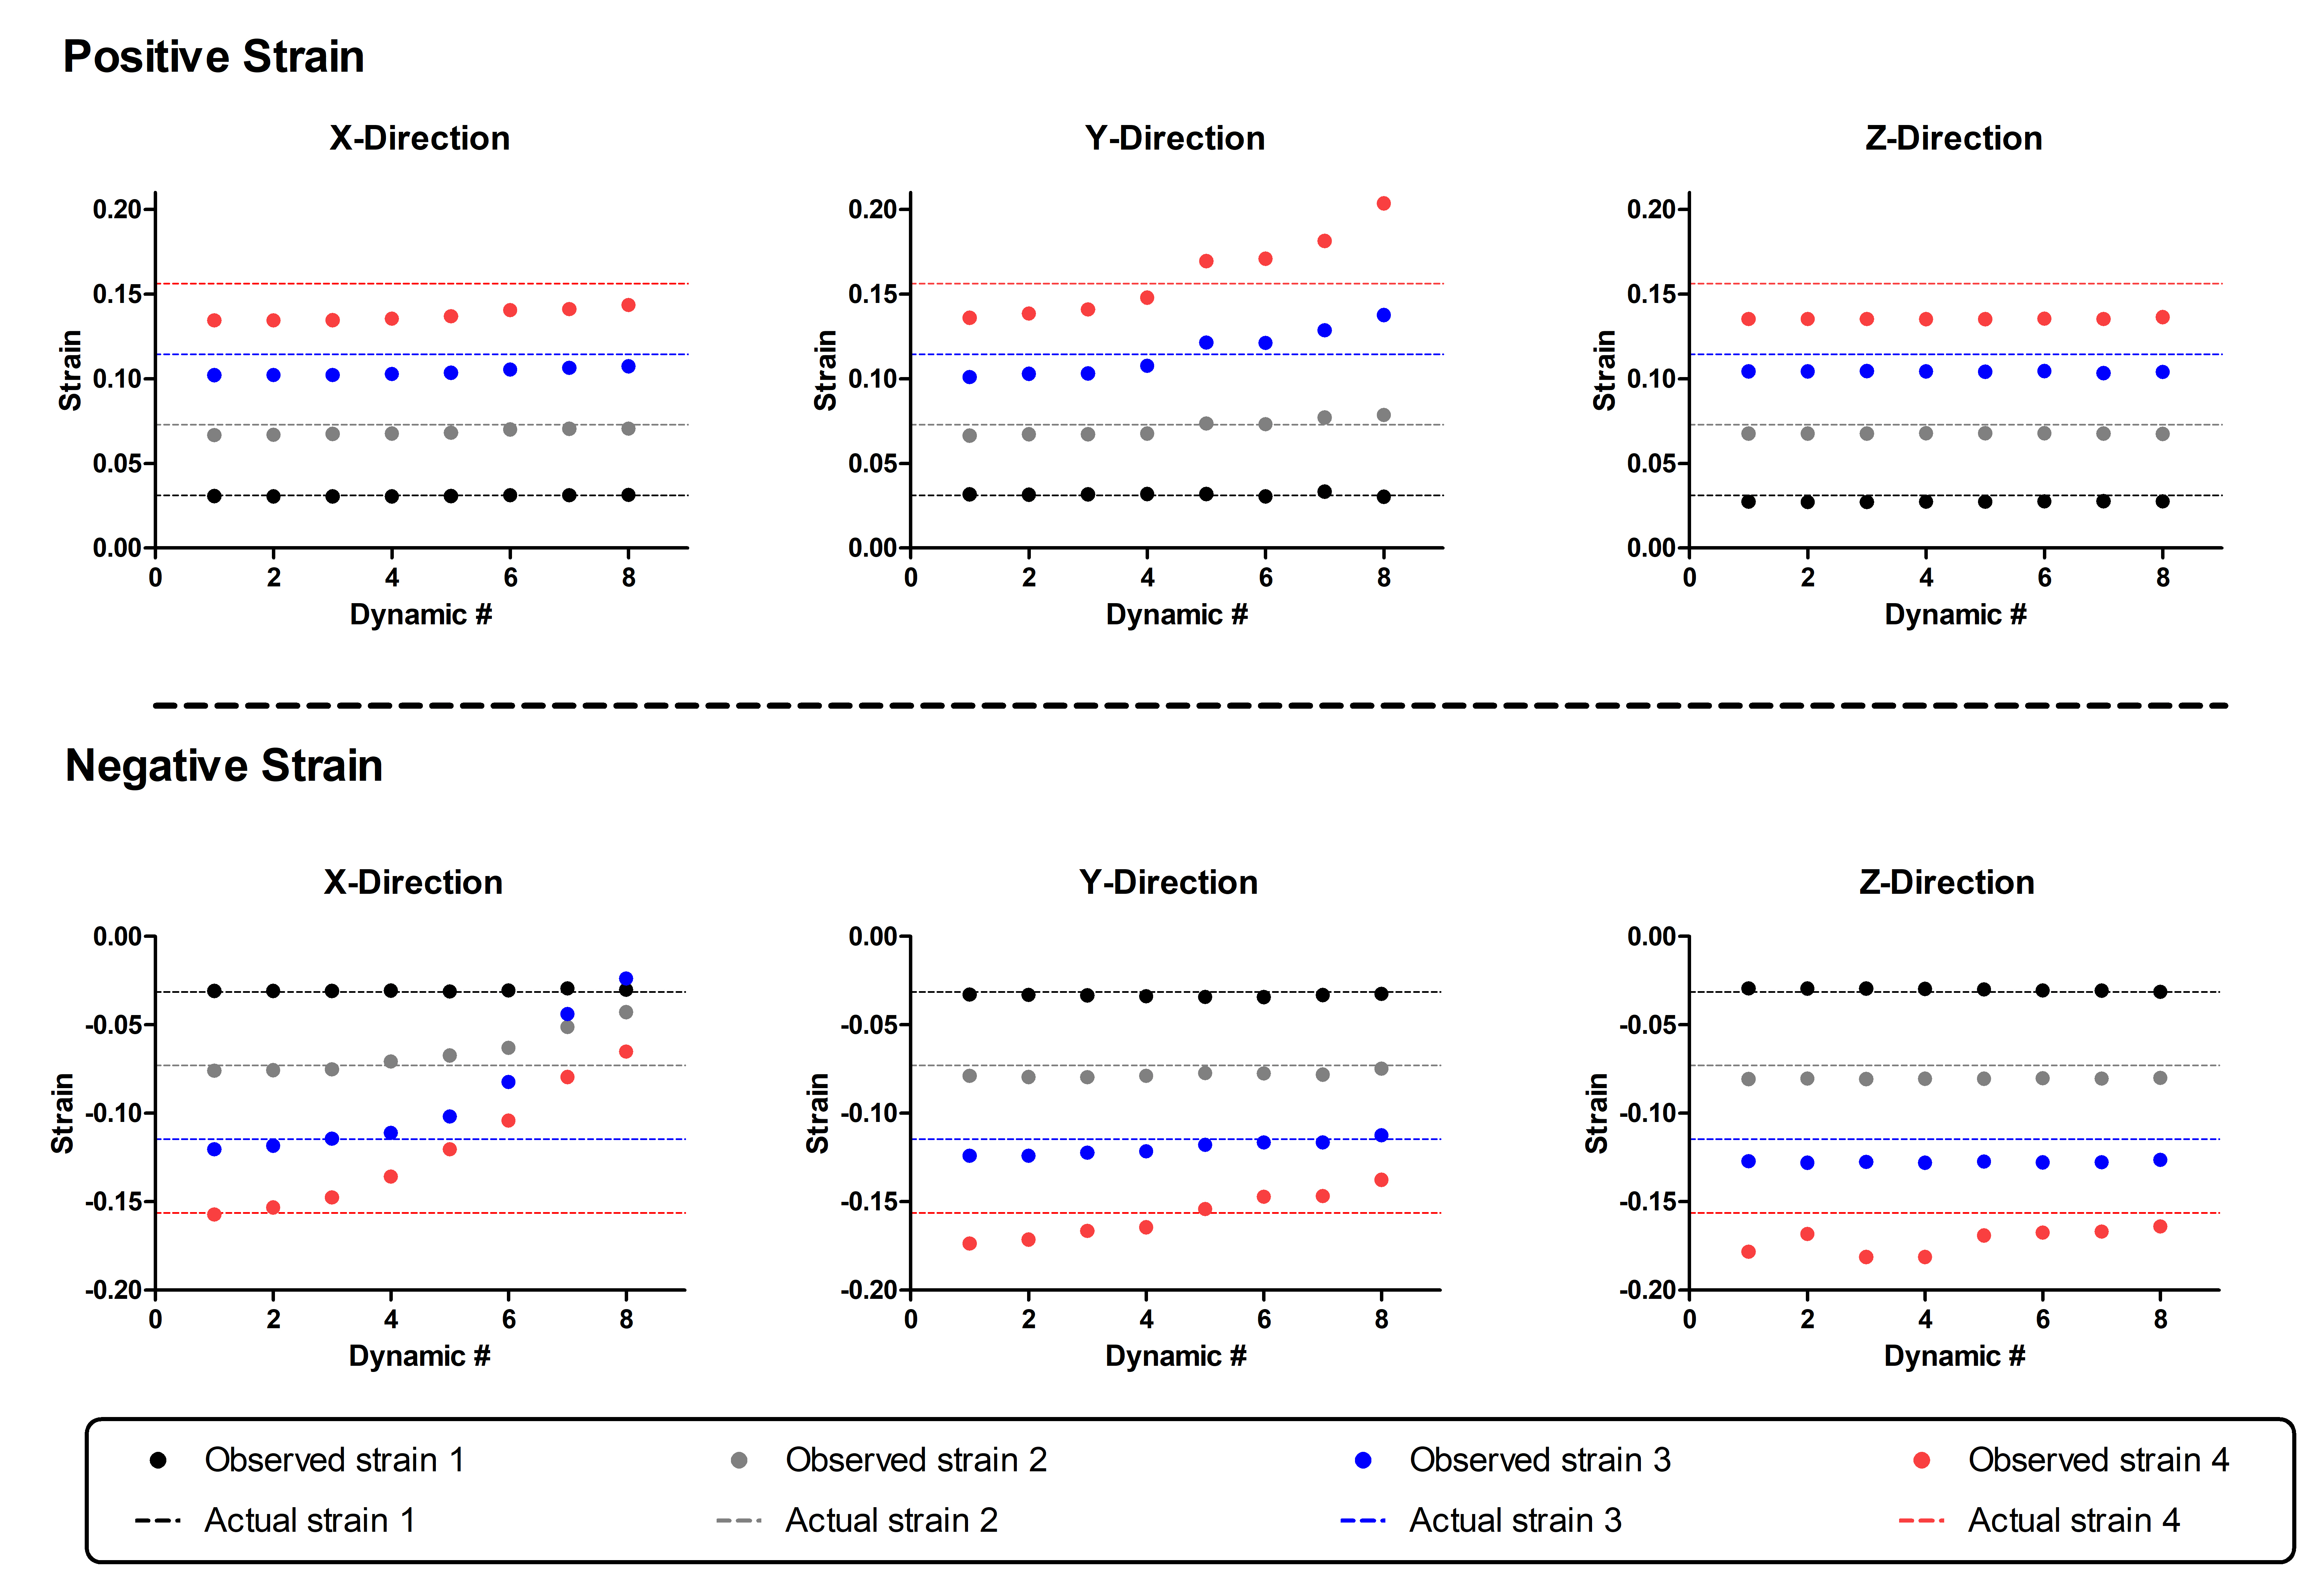
Figure 3. The actual and measured
strain for the positive and negative simulated strain levels (Strain 1= black; Strain
2 = gray; Strain 3 = blue; Strain 4 = red) for each of the dynamics using the
optimal elliptical filter size. The actual strain values are shown with dotted
lines in the graph (Actual strain 1 (+/- 0.031) = black; Actual strain 2 (+/-
0.073) = gray; Actual strain 3 (+/- 0.115) = blue; Actual strain 4 (+/- 0.156)
= red) . Each dot is the mean over the participants. Deformation in X-plane is
shown on the left, in the Y-plane in the middle and in the Z-plane on the right.