Claudia Weidensteiner1,2, Xeni Deligianni1,2, Tanja Haas1, Philipp Madoerin1, Oliver Bieri1,2, Meritxell Garcia3, Jacqueline Romkes4, Erich Rutz5, Francesco Santini1,2, and Reinald Brunner6
1Department of Radiology, Division of Radiological Physics, University Hospital Basel, Basel, Switzerland, 2Department of Biomedical Engineering, University of Basel, Basel, Switzerland, 3Department of Radiology, Division of Neuroradiology, University Hospital Basel, Basel, Switzerland, 4Laboratory for Movement Analysis, University Children's Hospital Basel, Basel, Switzerland, 5Hugh Williamson Gait Laboratory, The Royal Children's Hospital Melbourne, Parkville, Australia, 6Department of Orthopedic Surgery, University Children's Hospital Basel, Basel, Switzerland
1Department of Radiology, Division of Radiological Physics, University Hospital Basel, Basel, Switzerland, 2Department of Biomedical Engineering, University of Basel, Basel, Switzerland, 3Department of Radiology, Division of Neuroradiology, University Hospital Basel, Basel, Switzerland, 4Laboratory for Movement Analysis, University Children's Hospital Basel, Basel, Switzerland, 5Hugh Williamson Gait Laboratory, The Royal Children's Hospital Melbourne, Parkville, Australia, 6Department of Orthopedic Surgery, University Children's Hospital Basel, Basel, Switzerland
Calf muscle contraction speed was measured with
cine phase contrast MRI in children with cerebral palsy during (a) electrical
muscle stimulation (b) voluntary motion. Higher force but lower periodicity and
no distinct velocity peaks were achieved for voluntary vs. stimulated
contraction.
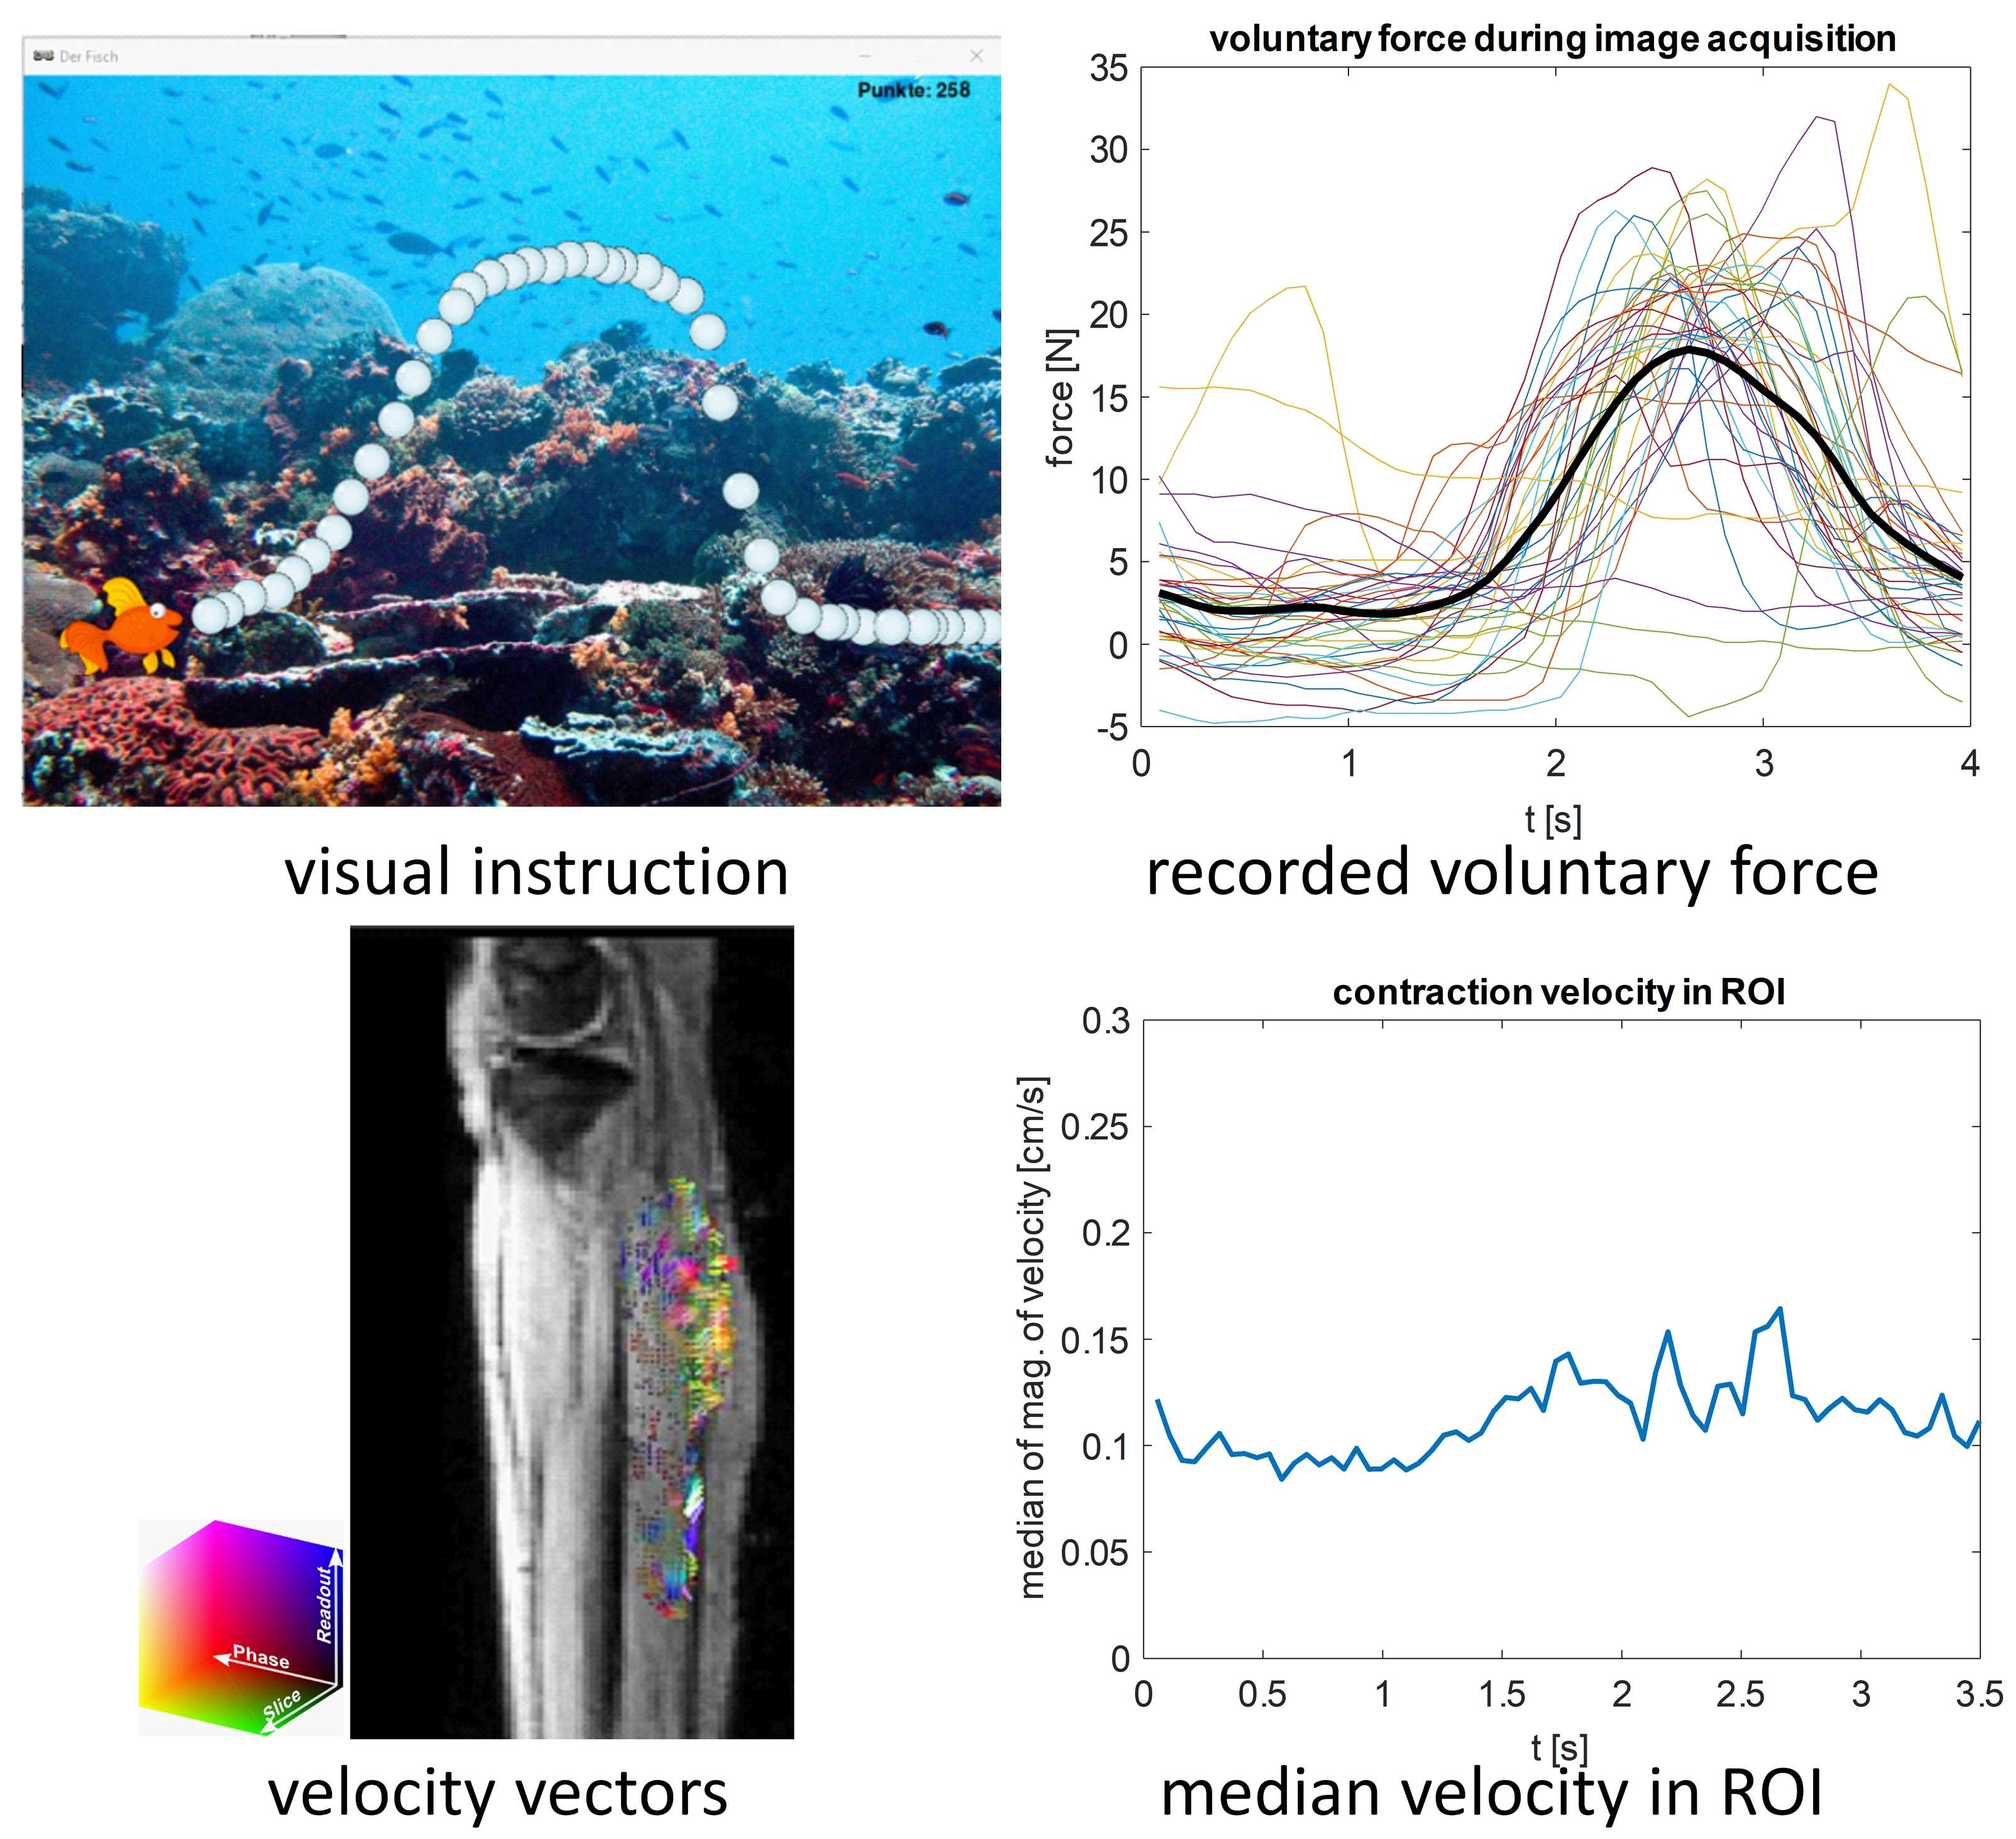
Figure 2: Cine phase contrast MRI experiment with
voluntary motion in a 11 y girl with diparetic cerebral palsy. Top left: visual
paradigm for instruction and feedback for the patient. Top right: time courses
of the force on the pedal with the mean force curve (over the
whole experiment) in black. Bottom left:
velocity vectors in the ROI in the calf at release. Bottom right: Time course
of the velocity magnitude (ROI median) showing several peaks.
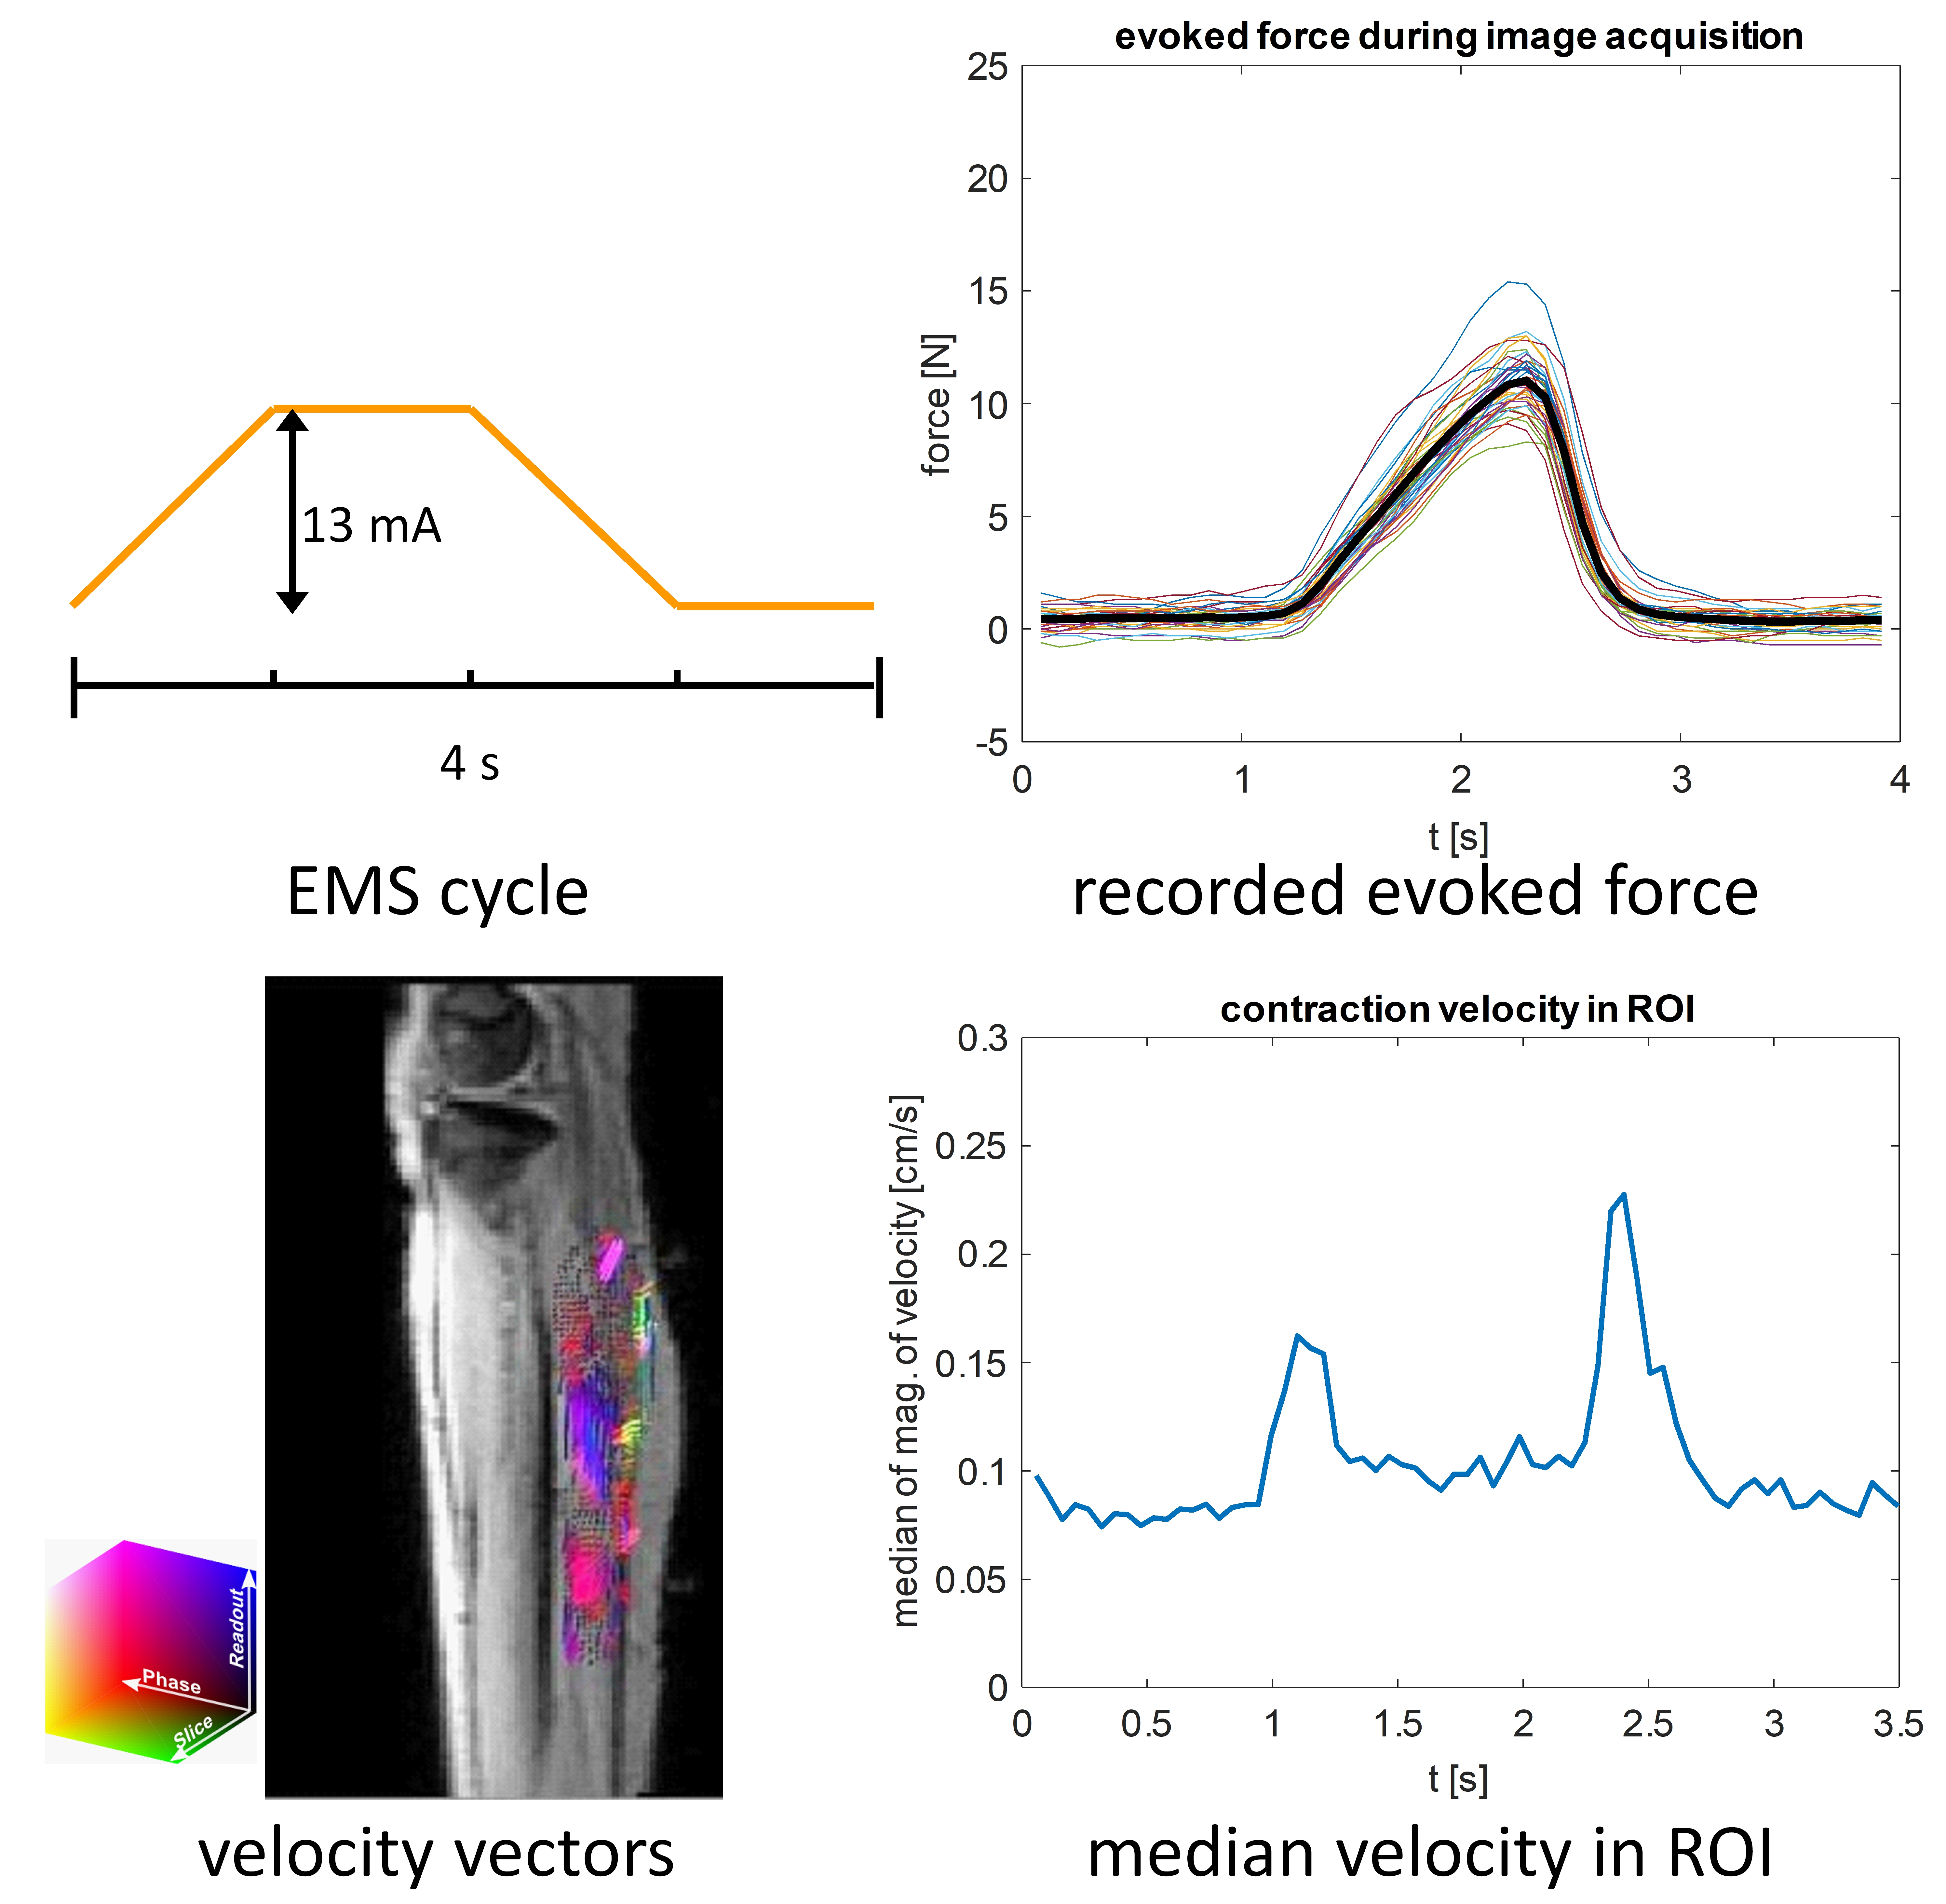
Figure 1: Cine phase contrast MRI experiment with
synchronized electrical muscle stimulation (EMS) in a 11 y girl with diparetic
cerebral palsy. Top left: current amplitude of the EMS cycle. Top right: time
courses of the evoked force on the pedal with the mean force curve (over the
whole experiment) in black. Bottom left: velocity vectors in the ROI in the
calf at release. Bottom right: Time course of the velocity magnitude (ROI
median) showing two peaks at contraction (left) and release (right).