Ho-Fung Chan1, James A Eaden1, Nicholas D Weatherley1, Kevin Johnson2, Guilhem J Collier1, Madhwesha Rao1, Graham Norquay1, Jody Bray1, Smitha Rajaram1, Andrew J Swift1, Ronald A Karwoski3, Brian J Bartholmai3, Stephen M Bianchi4, and Jim M Wild1
1Infection, Immunity and Cardiovascular Disease, University of Sheffield, Sheffield, United Kingdom, 2Radiology and Medical Physics, University of Wisconsin, Madison, WI, United States, 3Biomedical Imaging Resource, Mayo Clinic, Rochester, MN, United States, 4Academic Directorate of Respiratory Medicine, Sheffield Teaching Hospitals NHS Foundation Trust, Sheffield, United Kingdom
1Infection, Immunity and Cardiovascular Disease, University of Sheffield, Sheffield, United Kingdom, 2Radiology and Medical Physics, University of Wisconsin, Madison, WI, United States, 3Biomedical Imaging Resource, Mayo Clinic, Rochester, MN, United States, 4Academic Directorate of Respiratory Medicine, Sheffield Teaching Hospitals NHS Foundation Trust, Sheffield, United Kingdom
Normalized UTE 1H MRI signal correlates with IPF lung parenchyma changes on CT and may demonstrate sensitivity to longitudinal changes in a larger cohort.
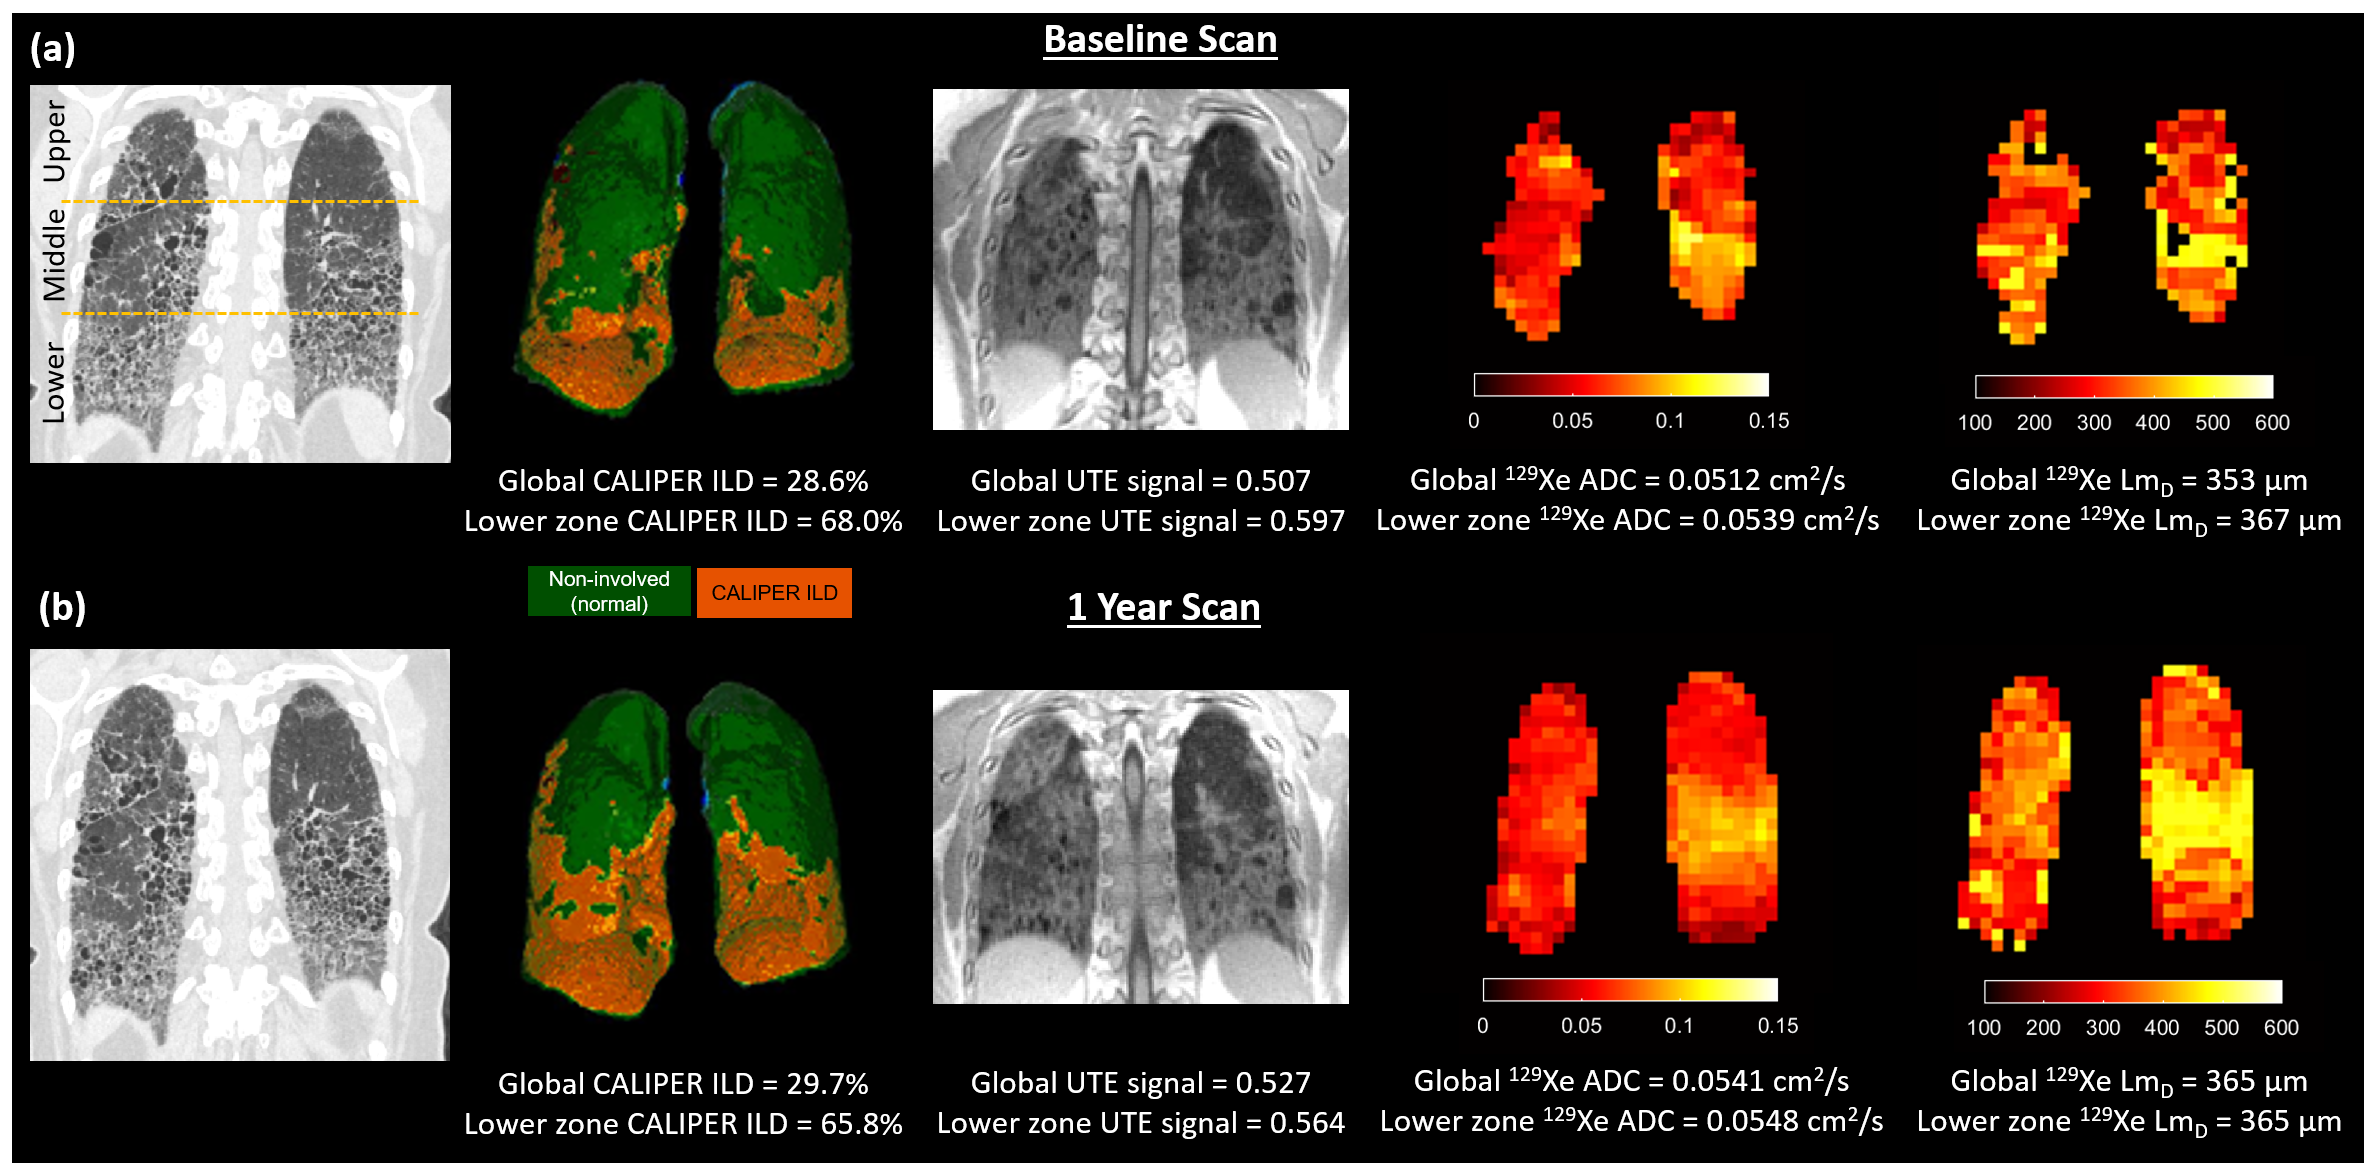
Figure 1:
Example images from CT, UTE MRI, and 129Xe DW-MRI for one IPF
patient. (a) Baseline images where CALIPER ILD%, UTE signal, 129Xe
ADC, and LmD are elevated in the lower zone compared to the global
mean value. (b) Images in the same patient after 1 year where increases in the
global mean value are observed for all imaging metrics.
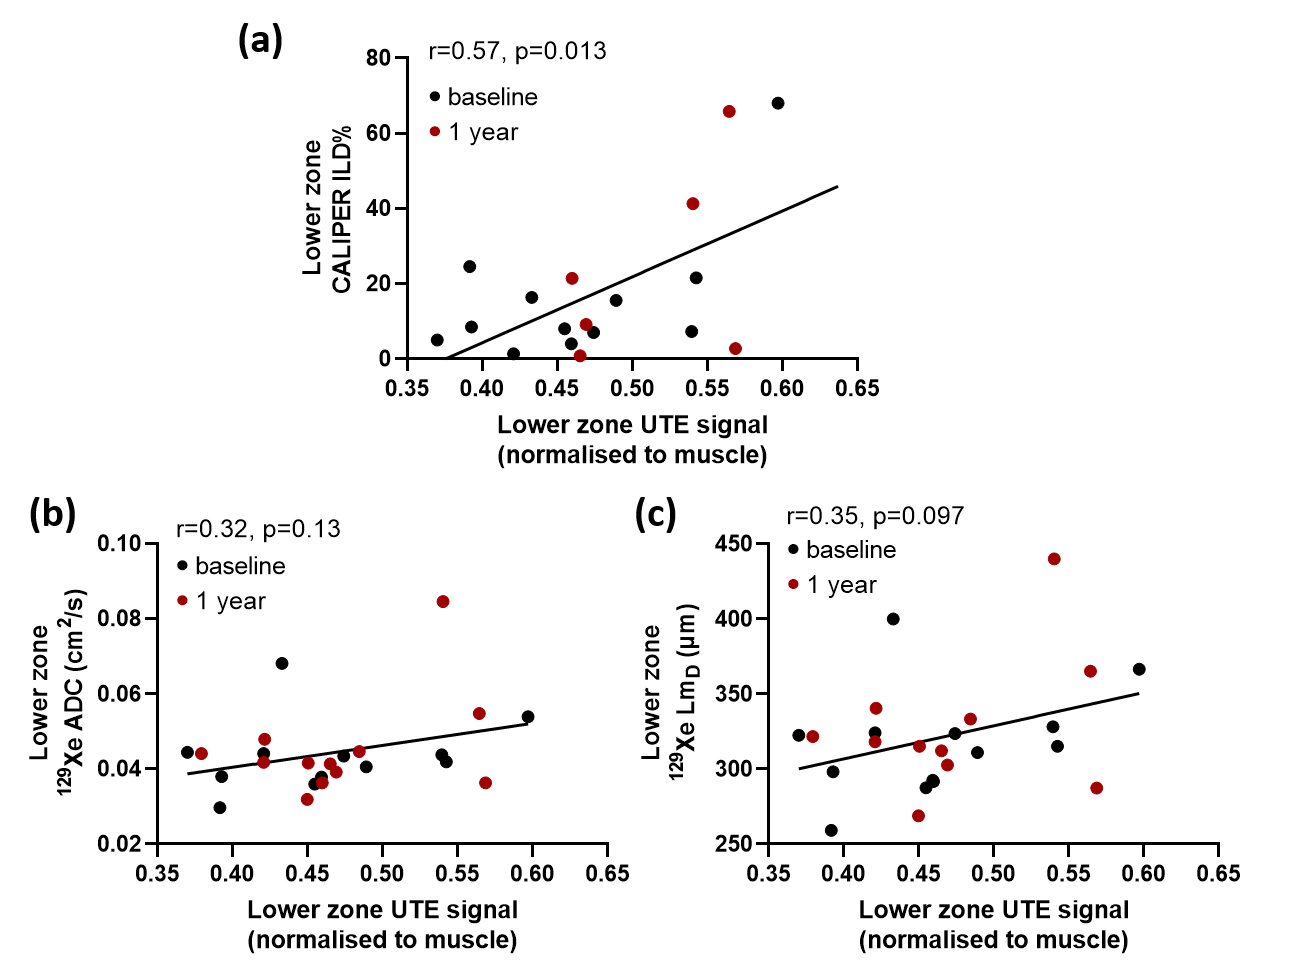
Figure 2:
(a) Scatter plot demonstrating a significant correlation between lower zone
normalized UTE signal and lower zone CALIPER ILD% values across both baseline
and 1 year scans. Scatter plots comparing lower zone normalized UTE signal with
lower zone 129Xe ADC (b) and LmD (c) values.