Weibo Gao1, Xin Chen1, Quanxin Yang1, and Xiaocheng Wei2
1Radiology, Second Affiliated Hospital of Xi’an Jiaotong University, Xi’an, Shaanxi, China, 2MR Research, GE Healthcare, Beijing, China
1Radiology, Second Affiliated Hospital of Xi’an Jiaotong University, Xi’an, Shaanxi, China, 2MR Research, GE Healthcare, Beijing, China
Quantitative T2, PD and ADC values were significant lower in malignant than that of benign breast lesions. Quantitative multi-parameters of T2+PD+ADC had the best performance compared to all the other quantitative plans and BI-RADS.
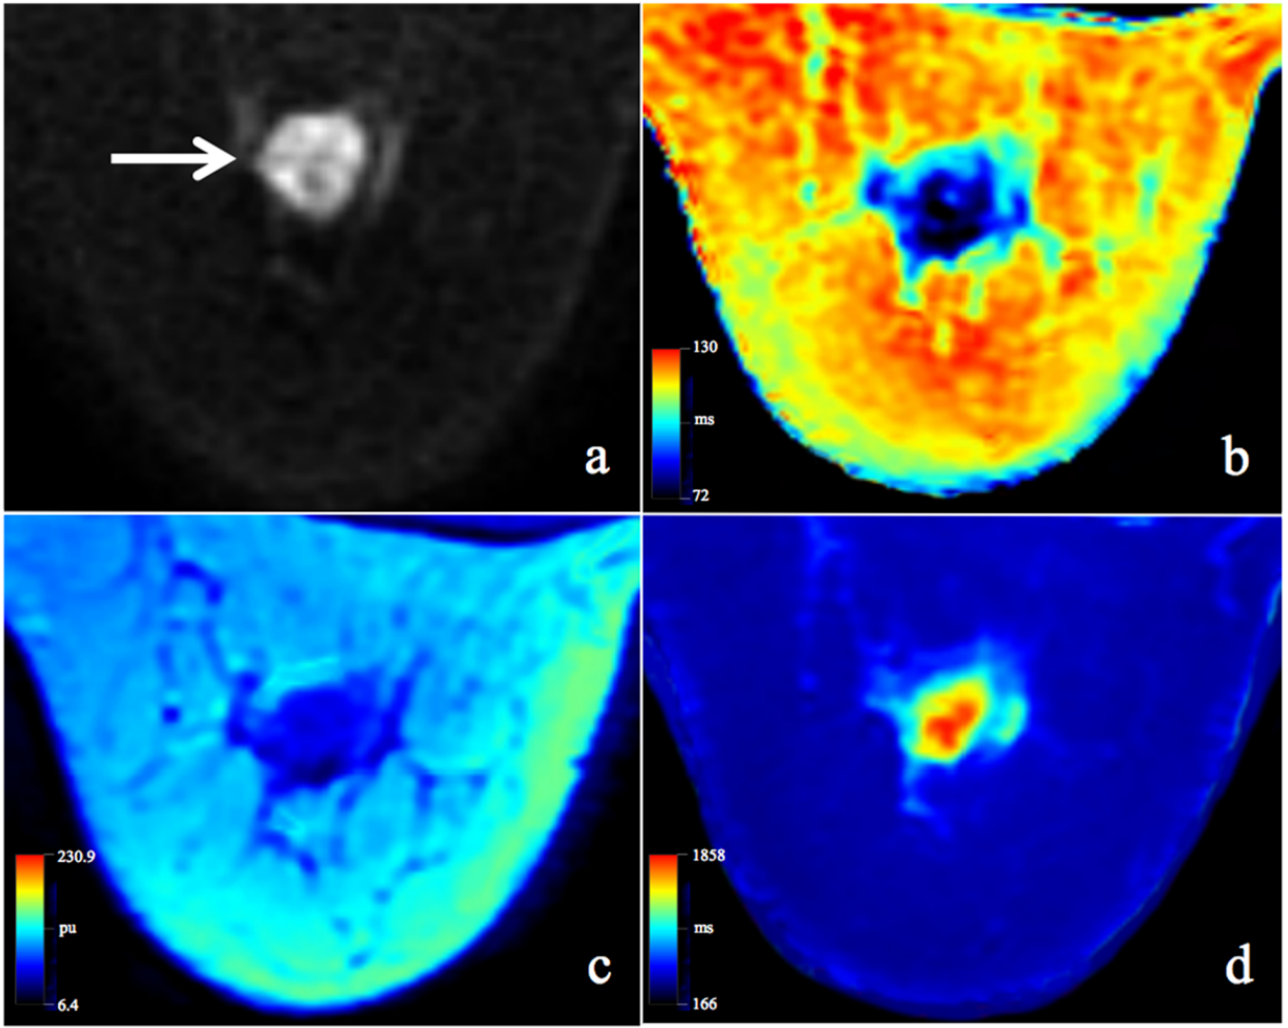
Figure 1: A 51-year-old woman with invasive ductal carcinoma in the left breast. (a) diffusion weighted imaging (DWI); (b) T2 map; (c) PD map; (d) T1 map. The lesion (arrow) showed quantitative T1 relaxation time (T1), T2 relaxation time (T2), proton density (PD) and apparent diffusion coefficient (ADC) values, and the quantifications by Reader A: T2 value=83 ± 11ms;PD value = 59.4 ± 10.3pu; T1 value = 1.26 ± 0.31 10-3ms; ADC = 0.85 10-3mm2/s and Reader B: T2 value = 83 ± 8ms;PD value = 59.3 ± 10.5pu; T1 value = 1.25 ± 0.30 10-3ms; ADC = 0.83 10-3mm2/s.
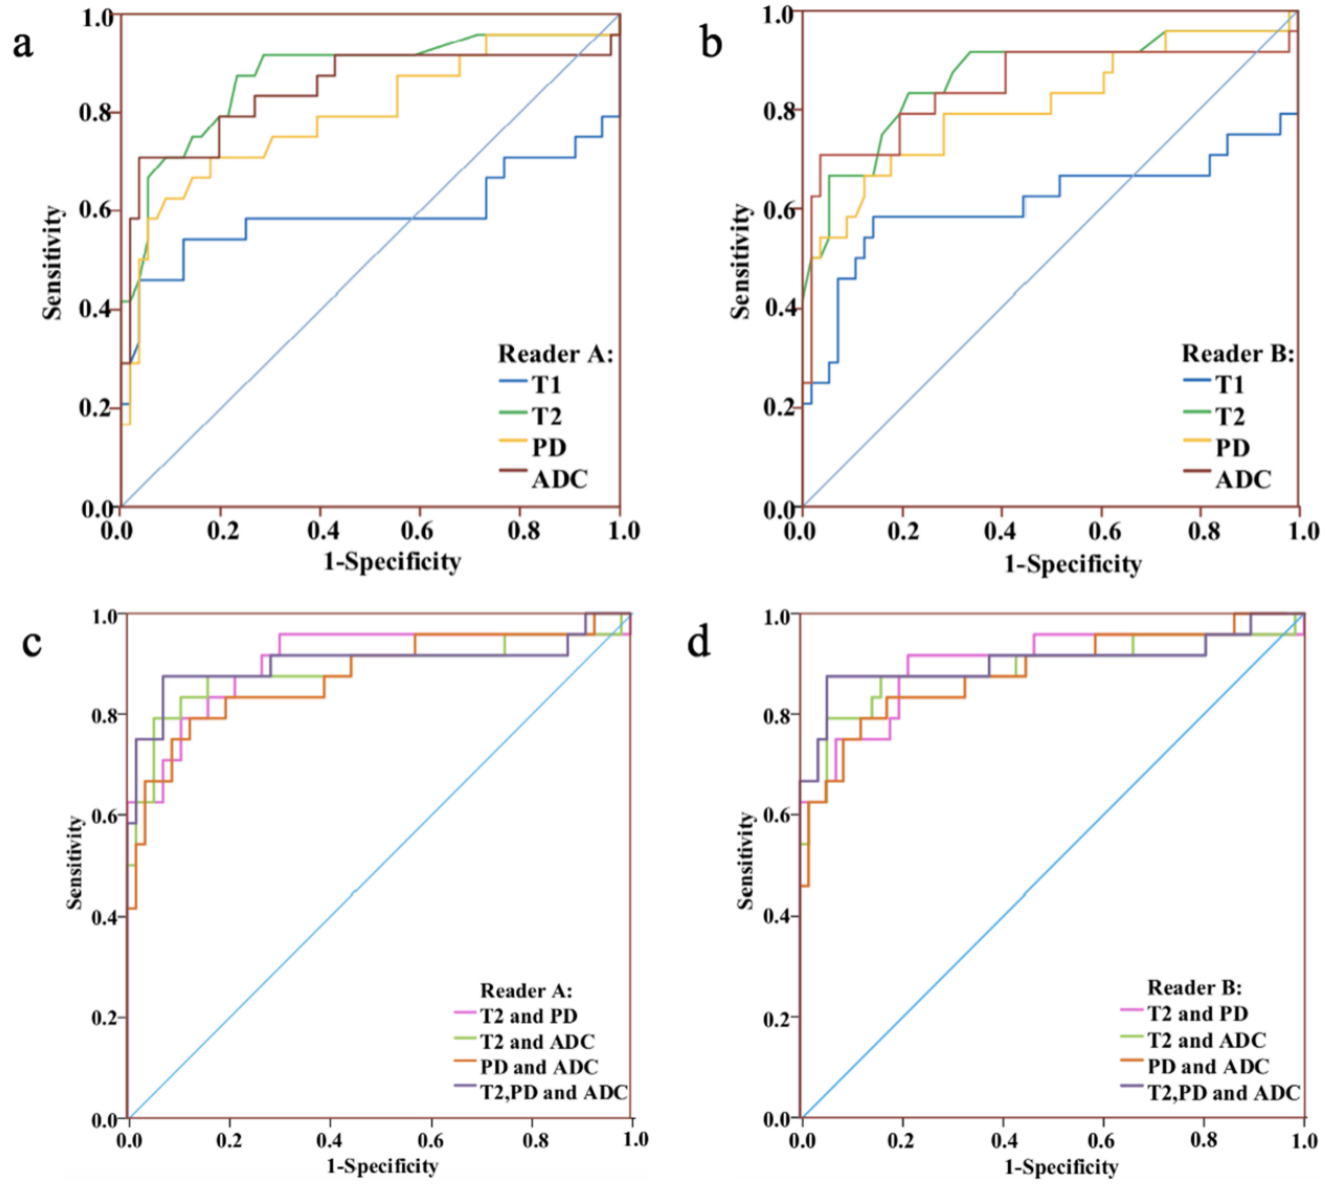
Figure 3: Receiver operating characteristic (ROC) curves of univariable analysis (a, b) and multivariable analysis (c,d). T1 = T1 relaxation time, T2 = T2 relaxation time, PD = proton density, ADC = apparent diffusion coefficient.