John Charles Waterton1,2
1Centre for Imaging Sciences, University of Manchester, MANCHESTER, United Kingdom, 2Bioxydyn Ltd, MANCHESTER, United Kingdom
1Centre for Imaging Sciences, University of Manchester, MANCHESTER, United Kingdom, 2Bioxydyn Ltd, MANCHESTER, United Kingdom
Published in vivo liver R1 data (N=3464 subjects, 0.04T-9.4T) were fitted to a biophysical model and a log-log heuristic. In the majority of studies, mean R1 deviated <9% from model with between-subject CoV<8%.
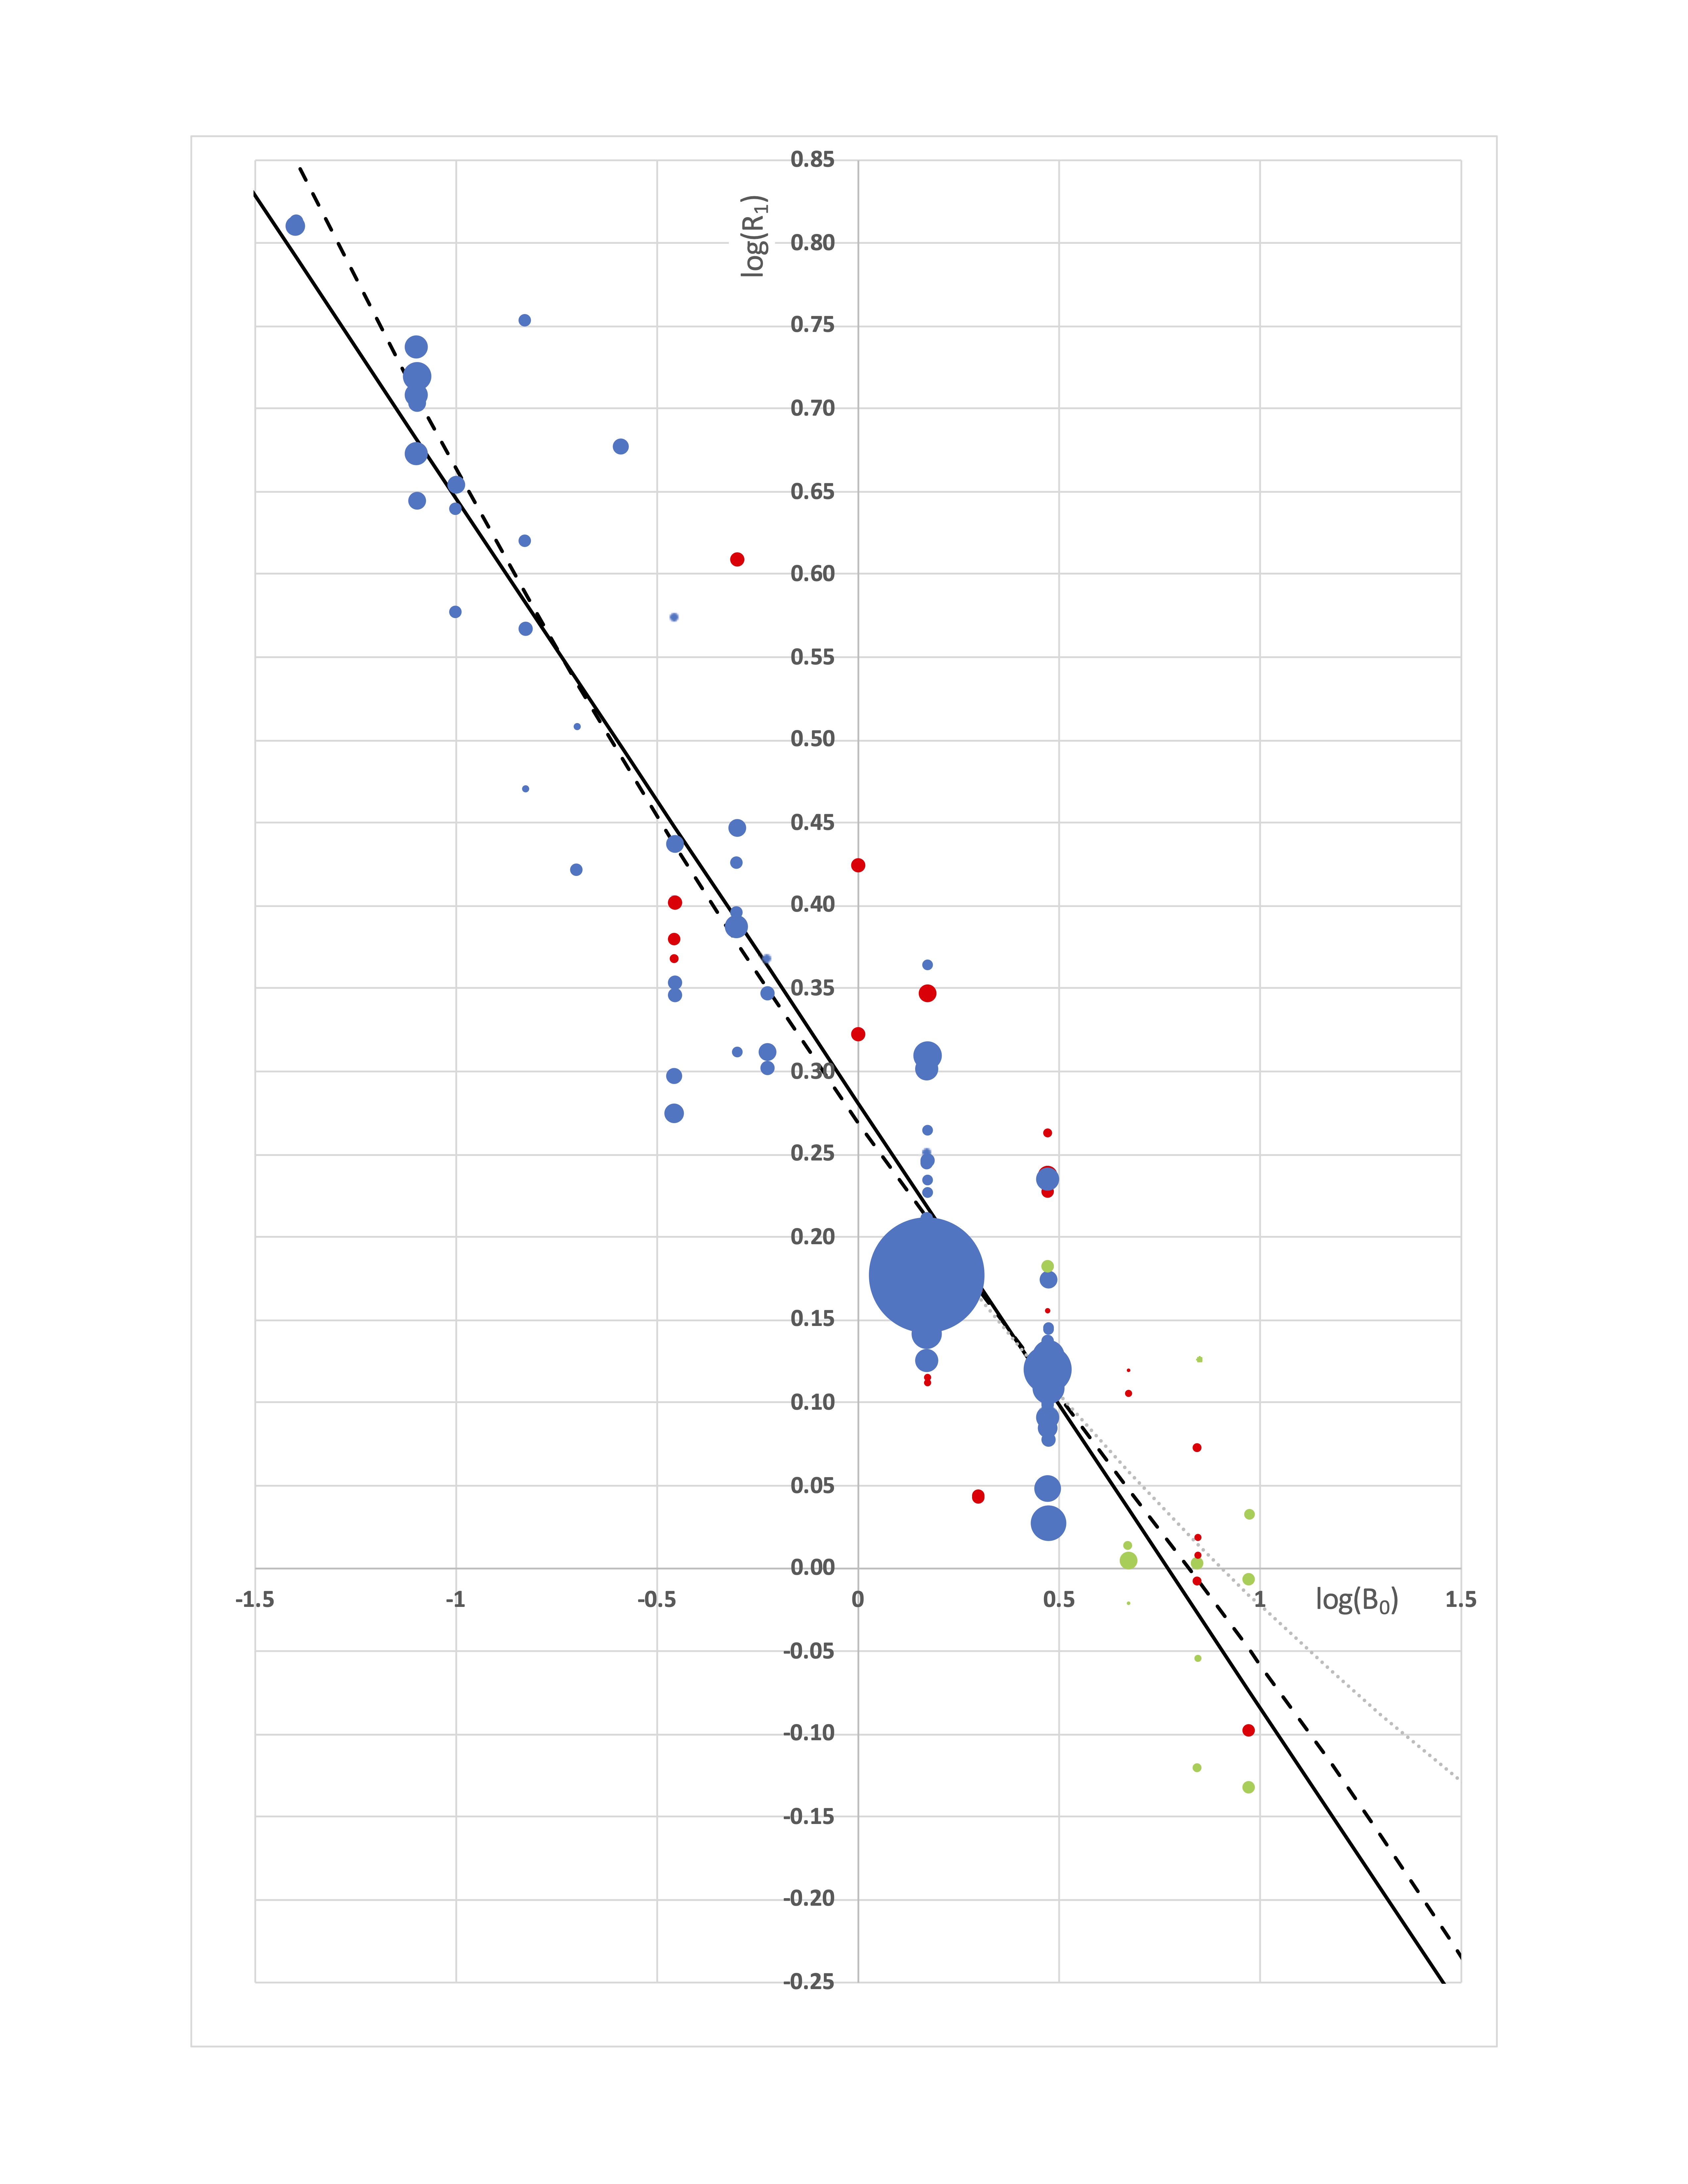
FIGURE 1. Log-log plot of R1 against B0. Blue: human; Red: rat; Green: mouse. Each symbol represents one study. Size of circle reflects number of subjects (some smaller symbols are occluded by larger symbols). Solid black line: Eq.1. Dashed black line: Eq.2 with R1,inf=0.213s-1. The dotted line shows, purely for illustrative purposes, a fit to Eq.2 where R1,inf was fixed arbitrarily at a higher value of 0.5s-1.
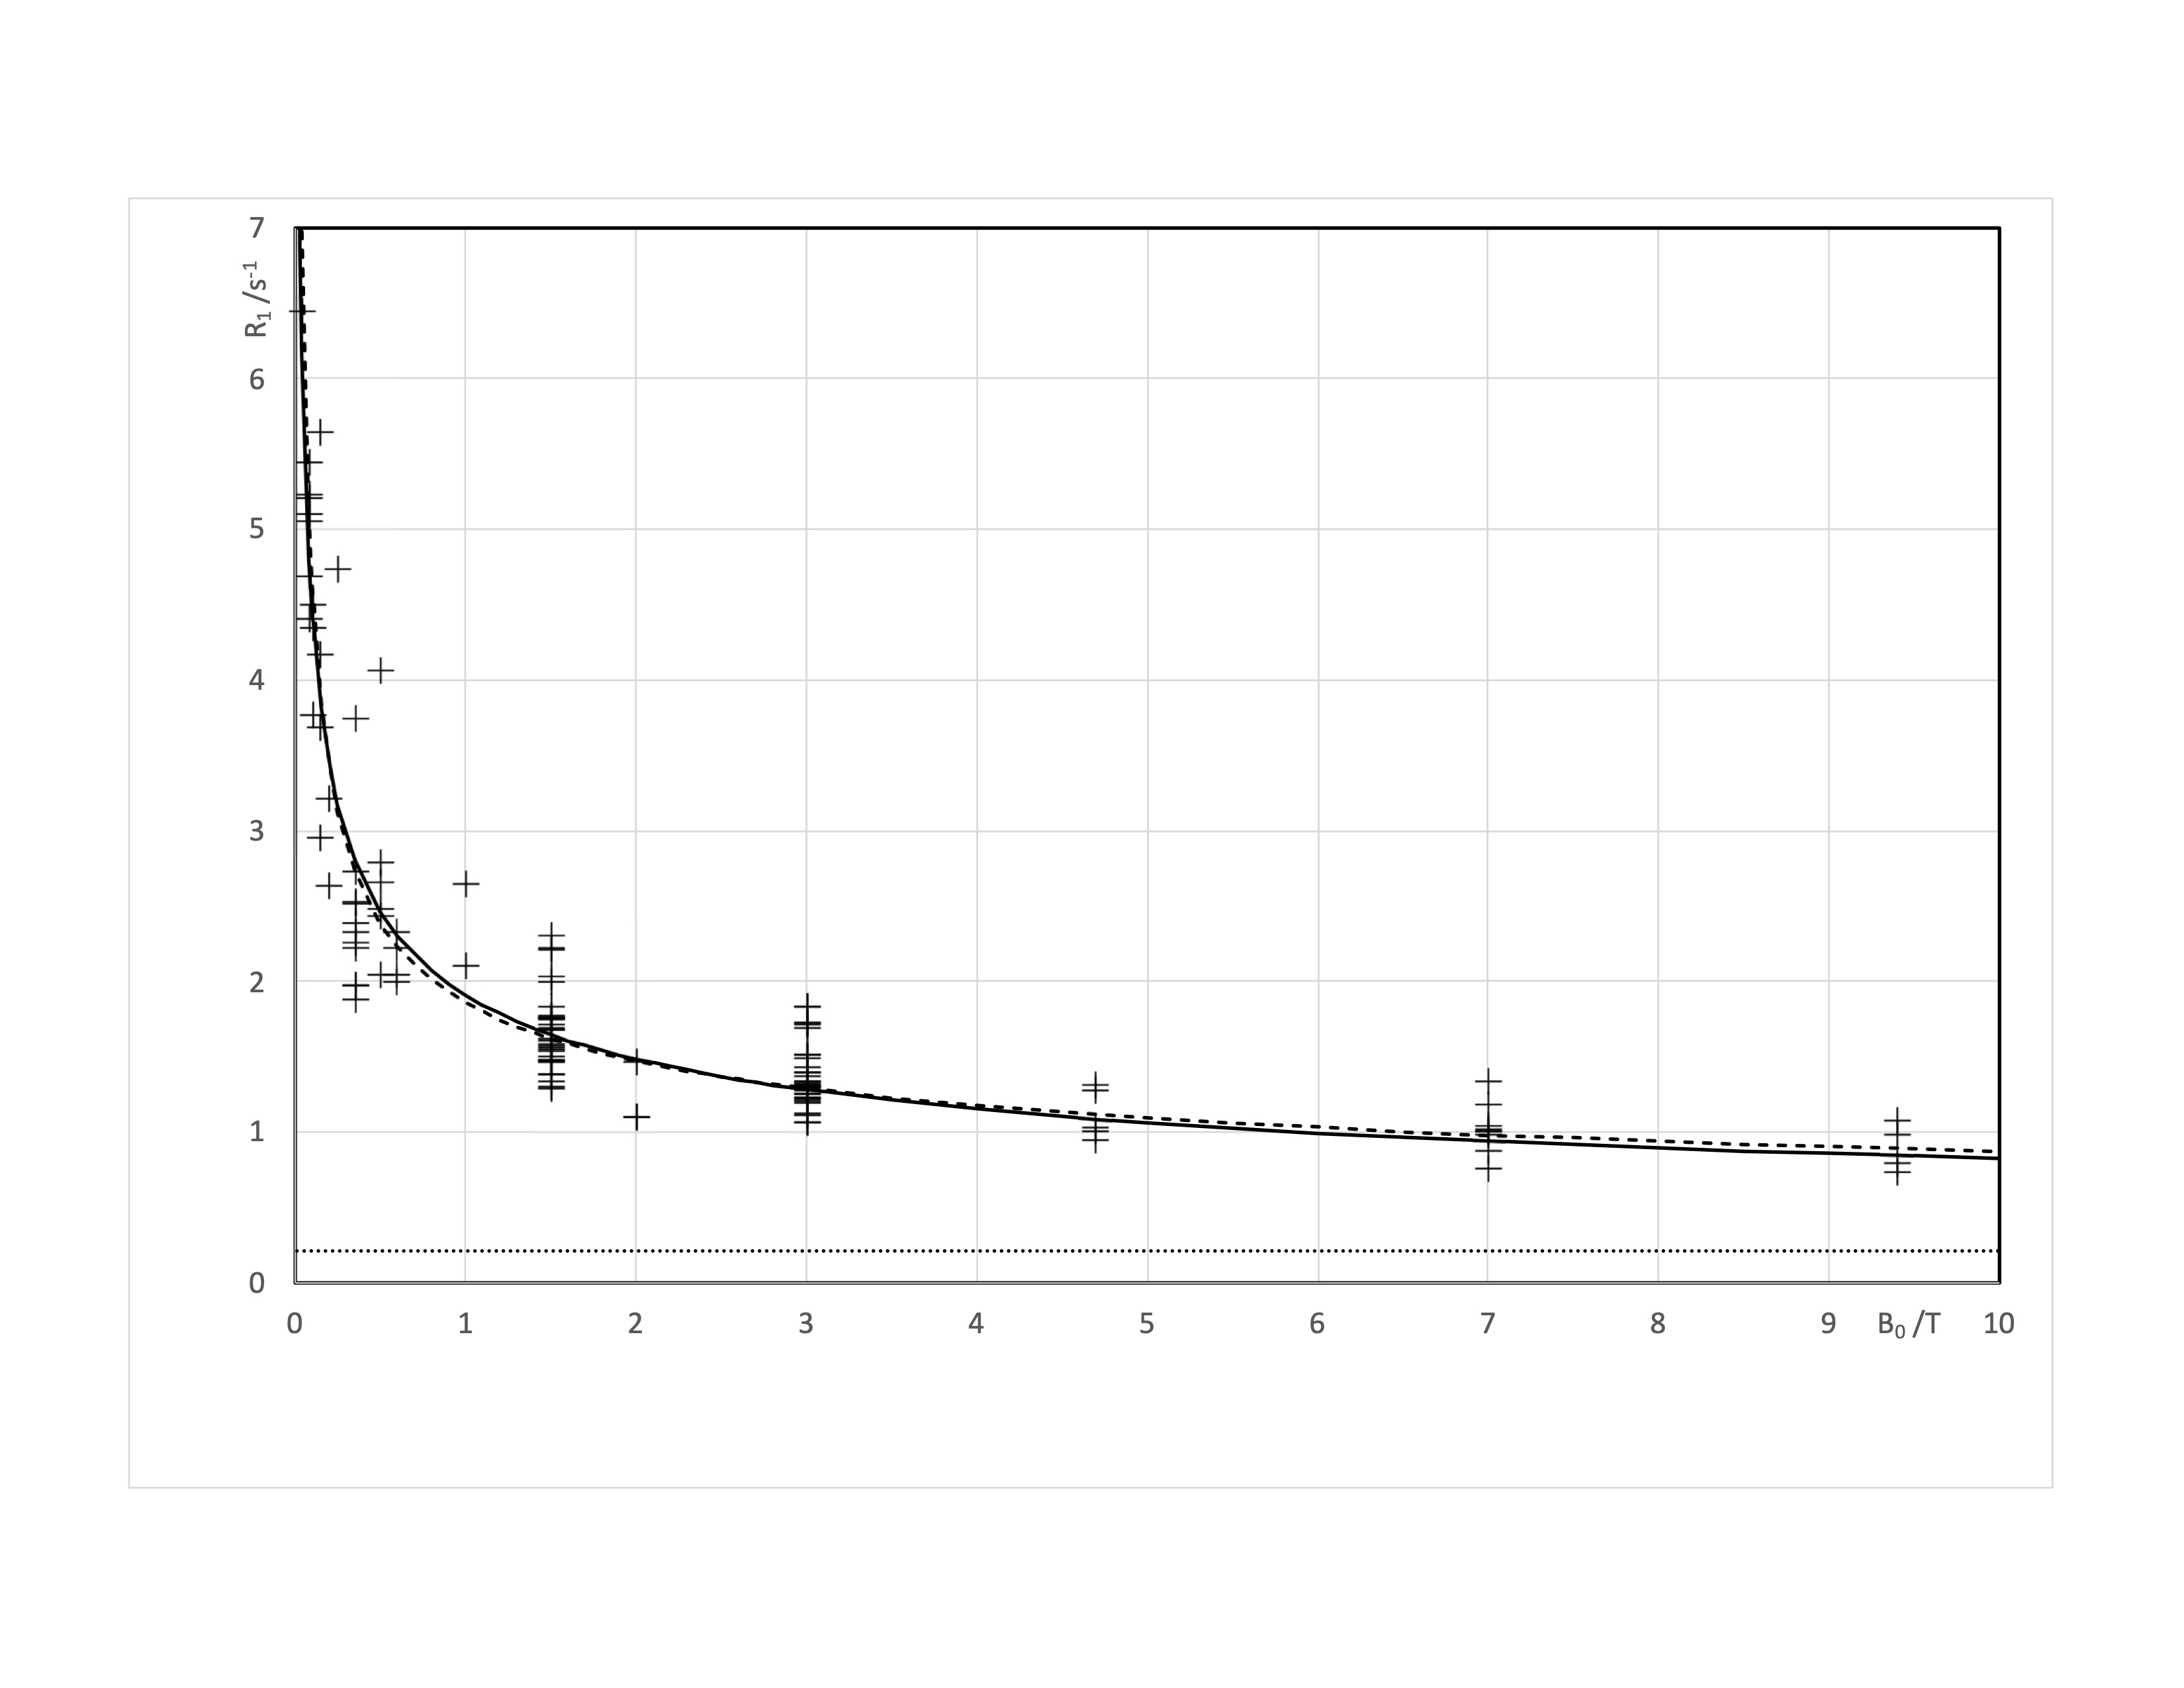
FIGURE 2. Plot of R1 against B0. Each symbol represents one study. Solid black line: Eq.1. Dashed black line: Eq.2 with R1,inf.=0.213s-1. Dotted line: R1,inf.
